khanh nguyen
I conducted a research project on slime stretchiness, cumulating in a final poster presented at a poster session and a final research paper. This was an individual research project as part of MIT's junior year capstone mechanical engineering class. The project had guidance from both mechanical engineering faculty members and outside consumer sources.
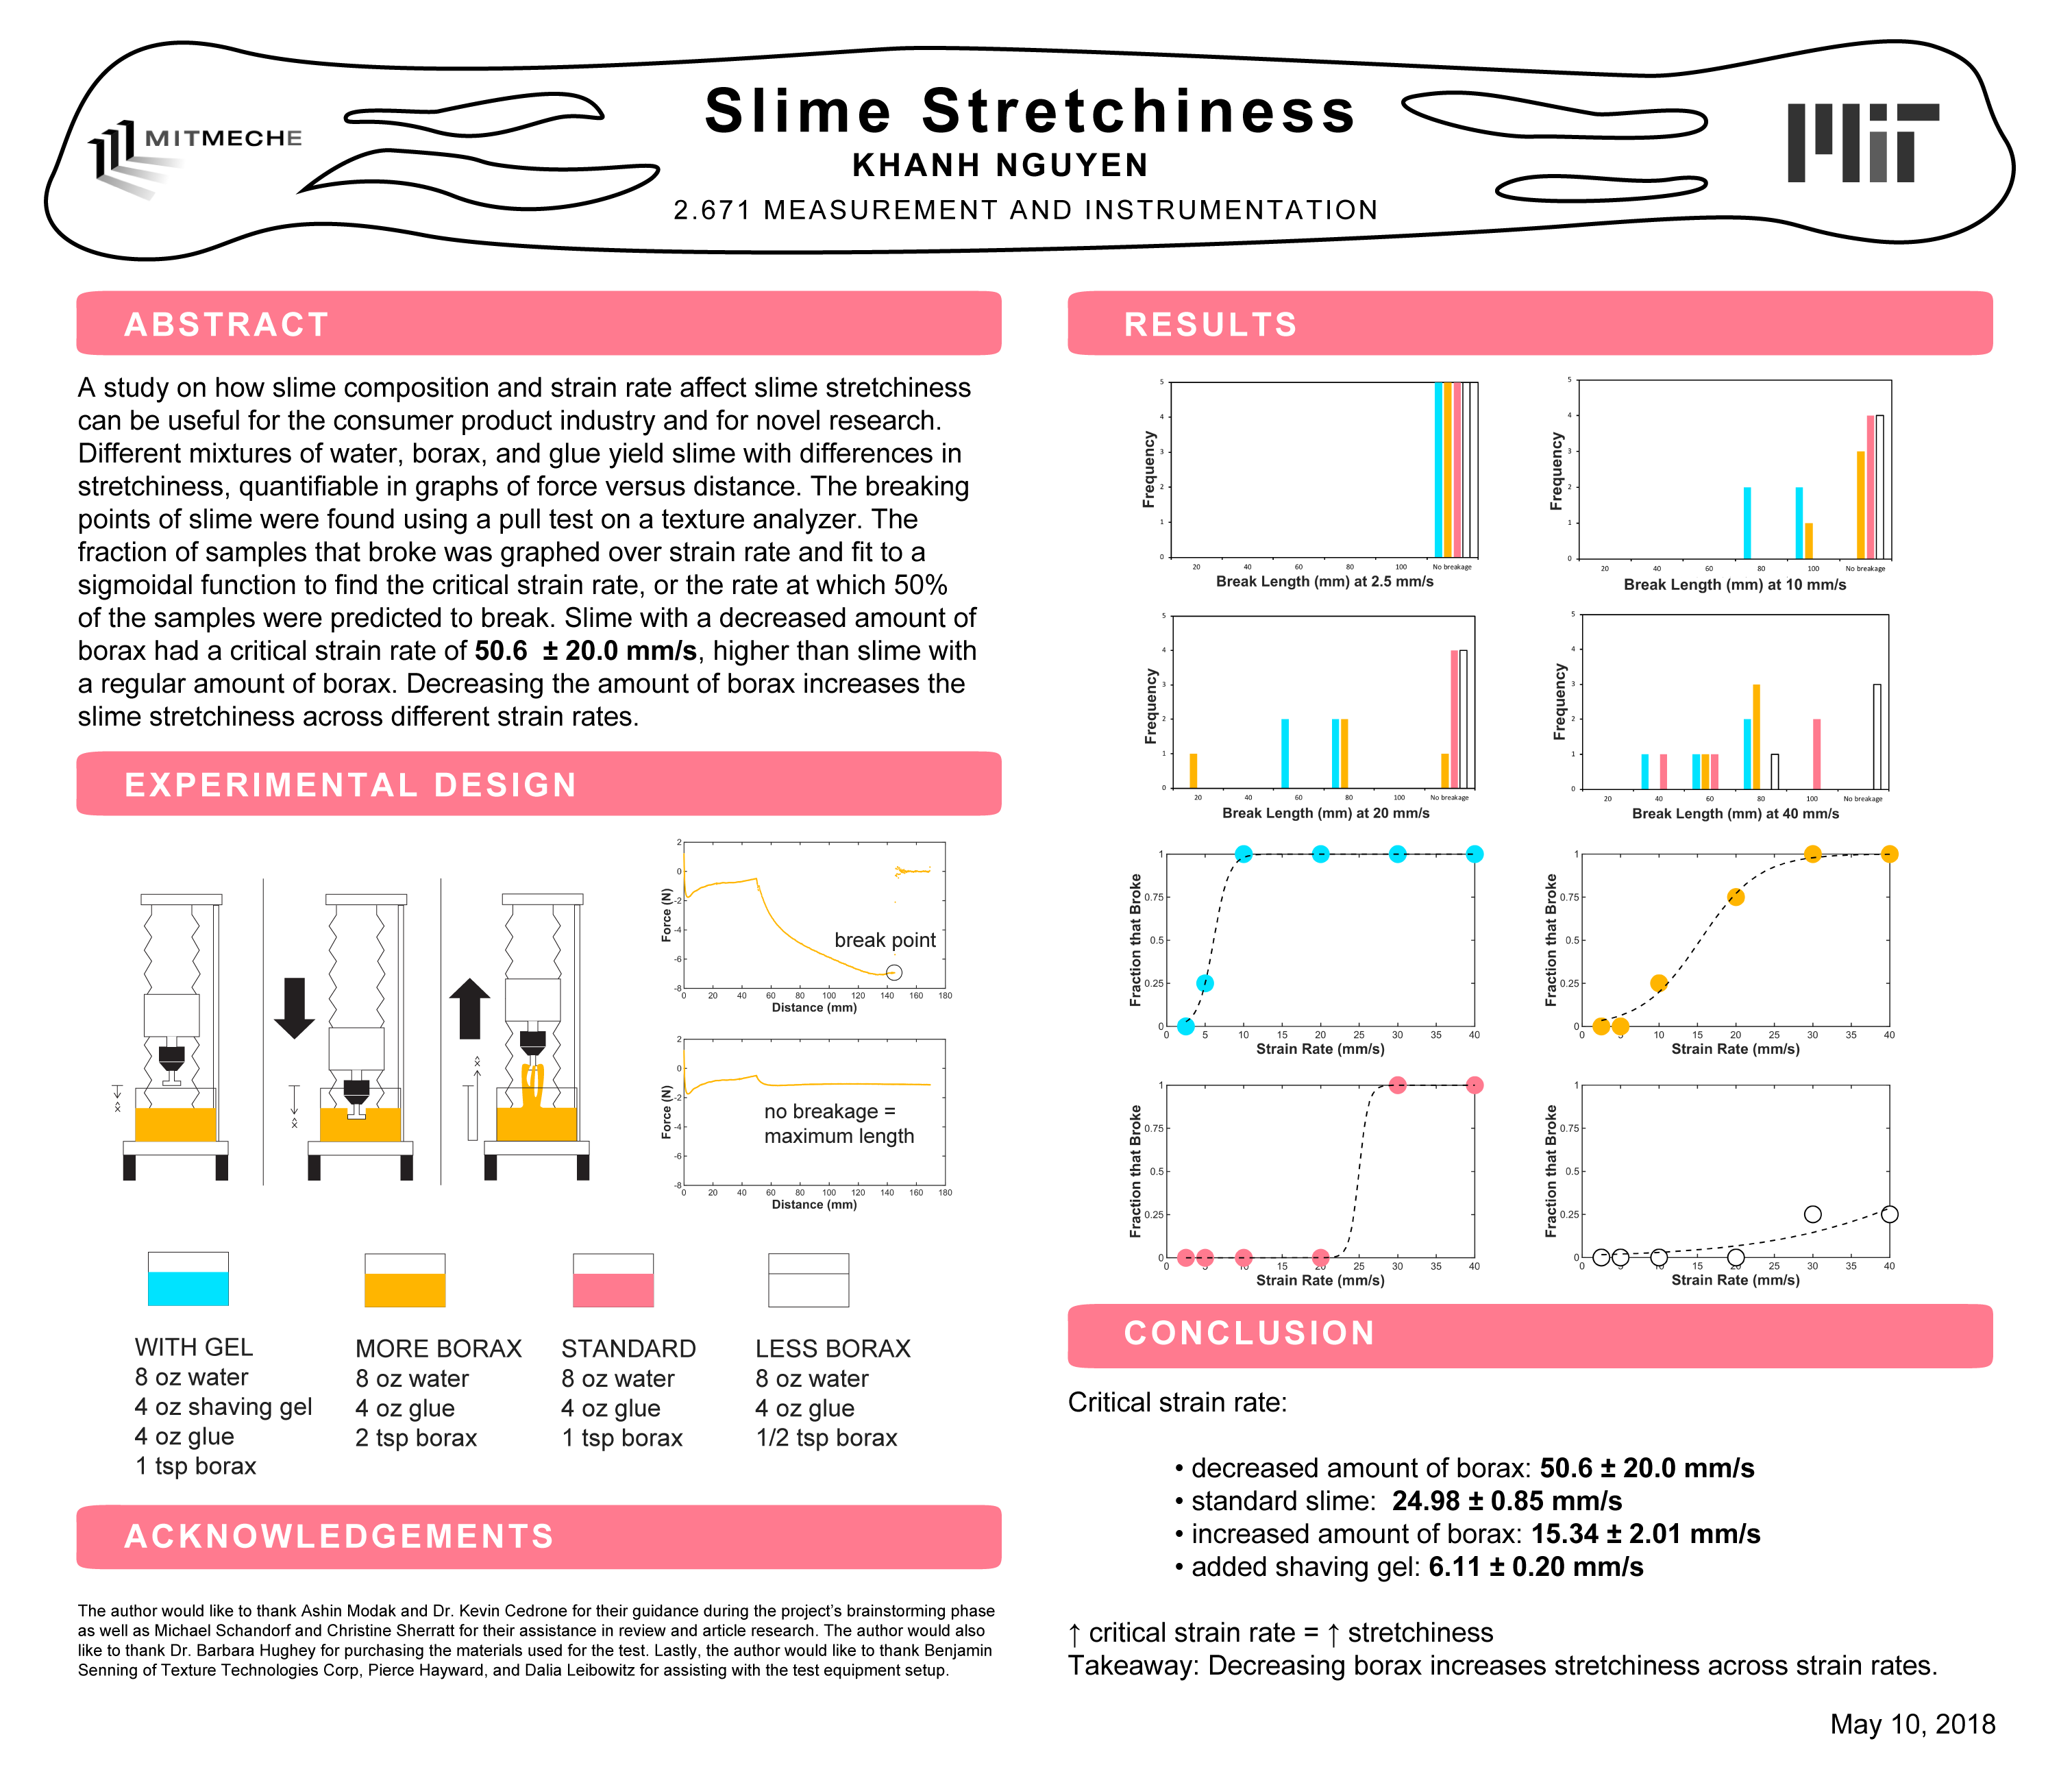
My goal was to optimize slime stretchiness and to discover how altering the slime composition and strain rate affects stretchiness. This can be useful in both the consumer product industry and in novel research applications such as stretchable strain sensors and electrochromic devices. Inspiration from the project came from following consumer slime trends on Instagram and YouTube.
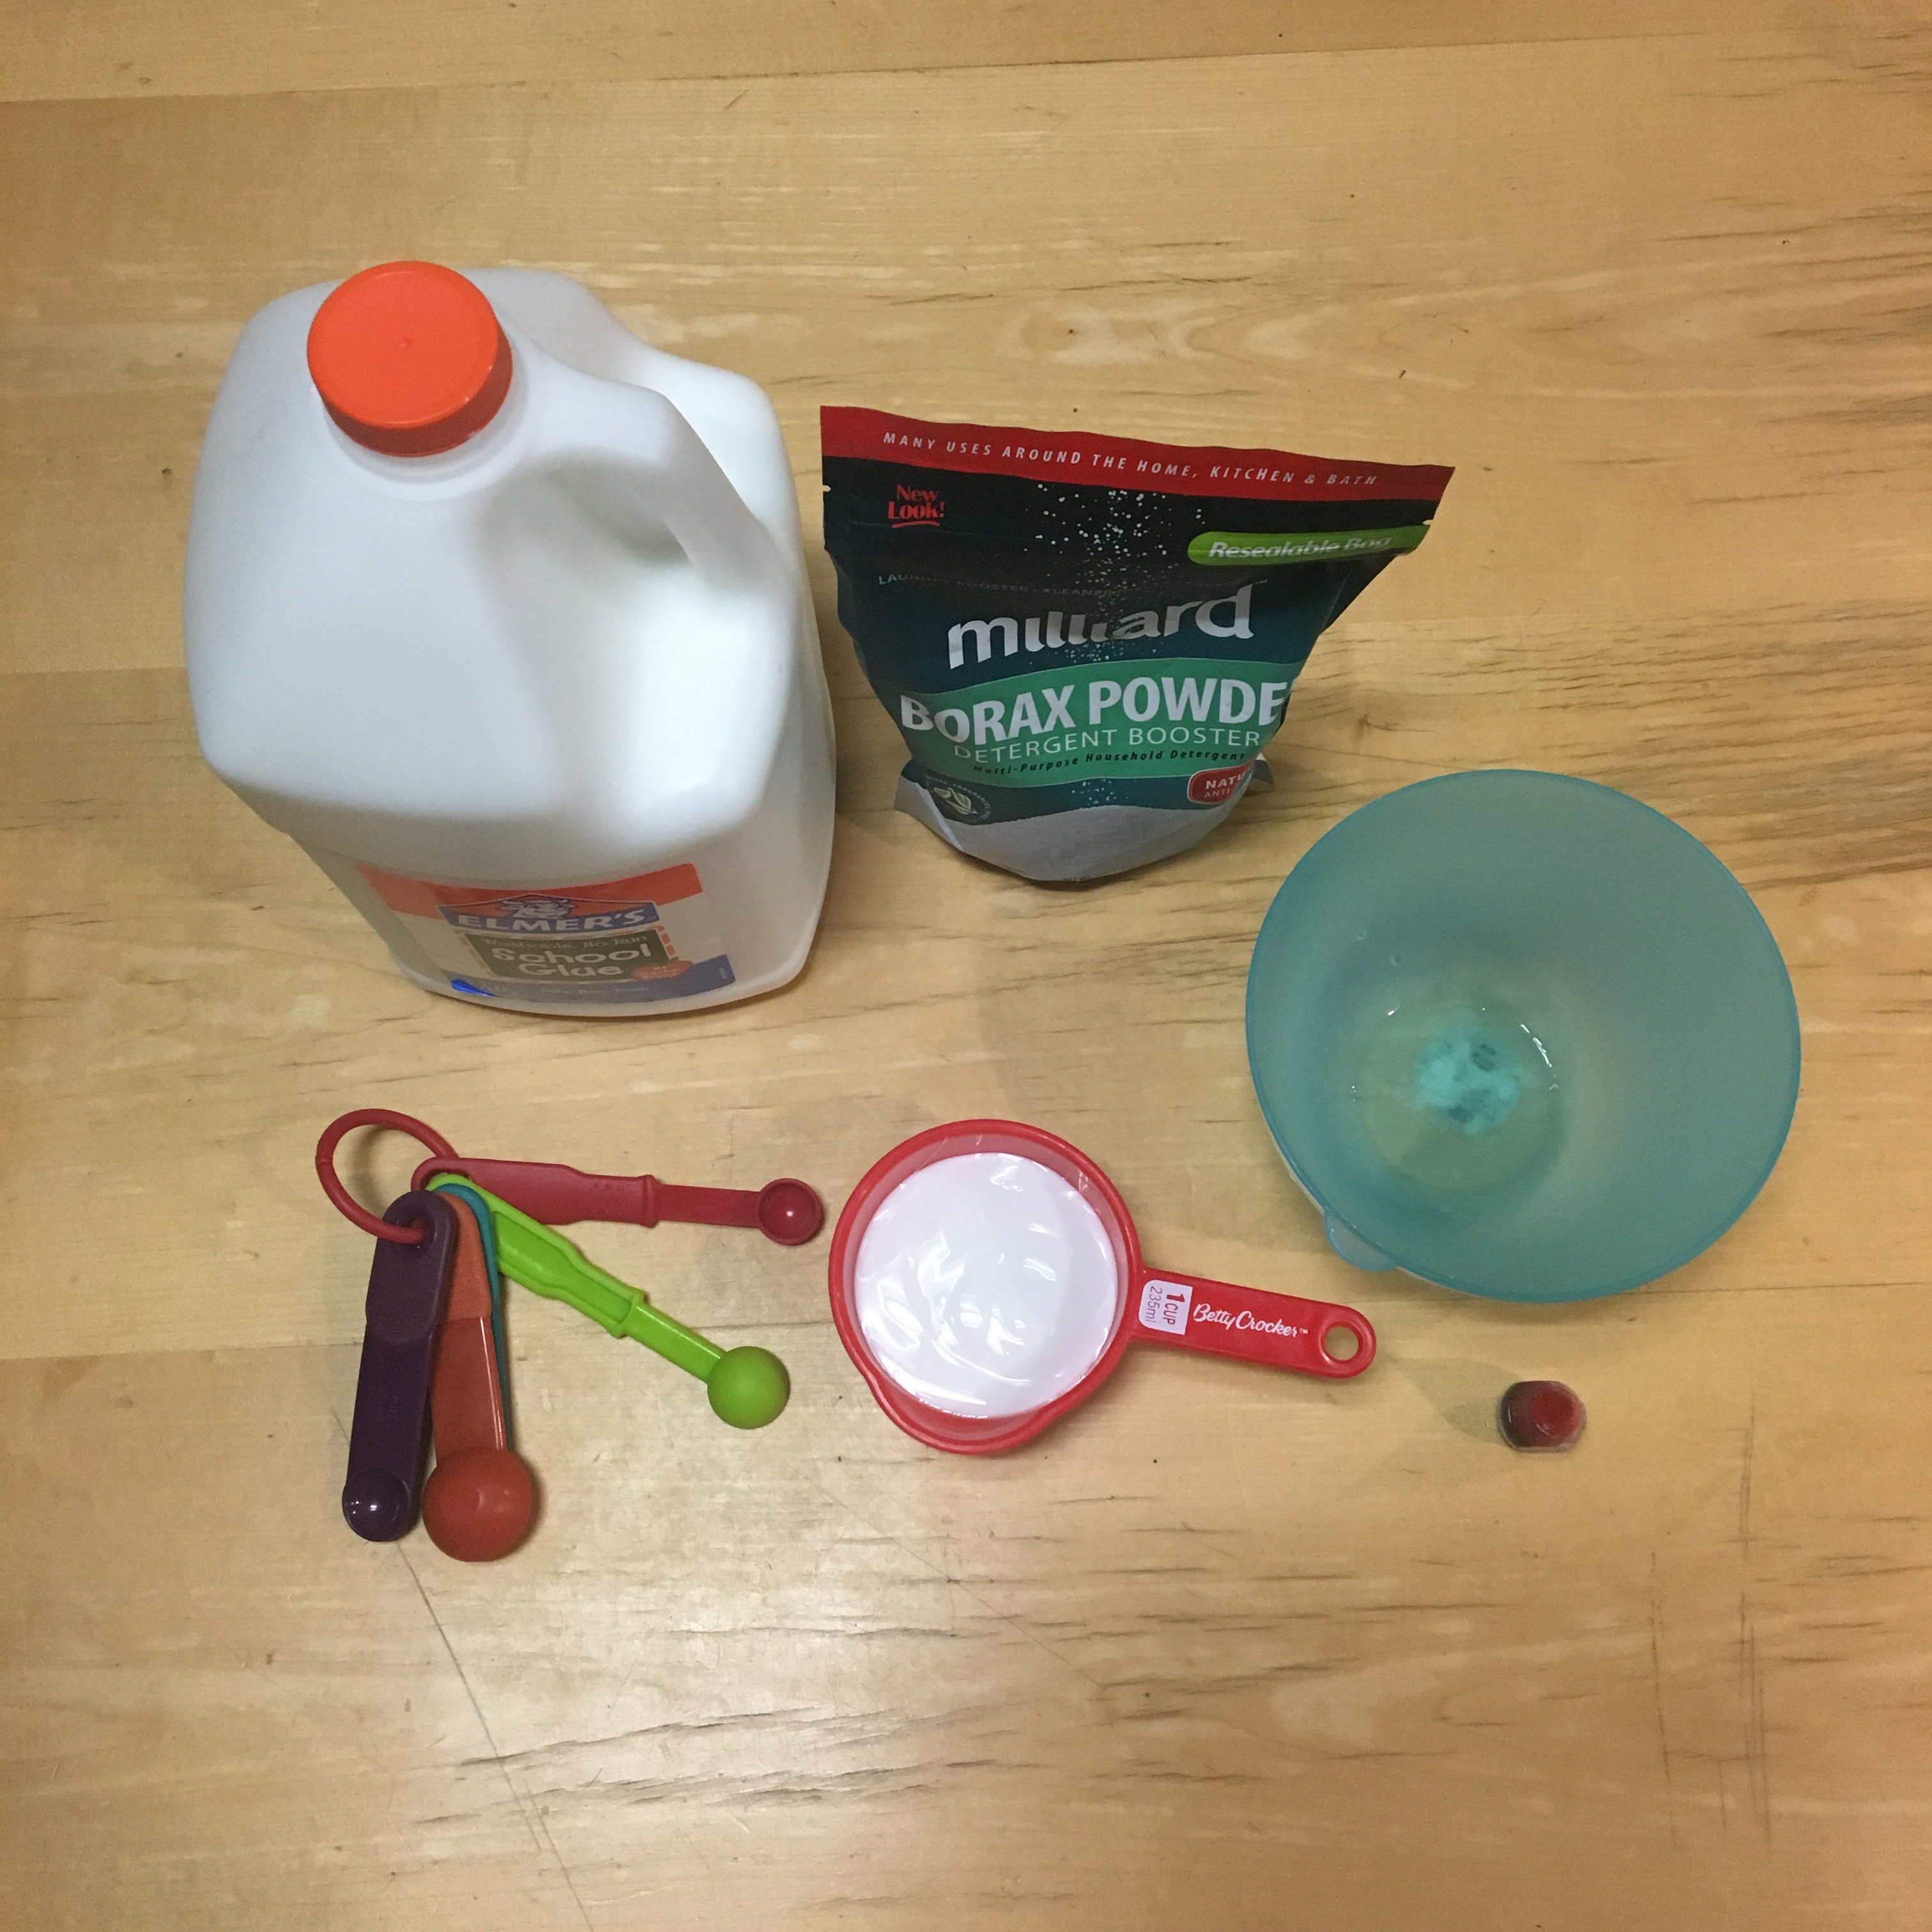
After conducting background research on slime, I had to figure out how to define stretchiness ("the ability to expand while under tensile stress") and then how to test that stretchiness. I settled on using a stretch test on a texture analyzer. I stretched different samples of slime that I created on the texture analyzer at different strain rates and noted down when they broke. Slime samples were made using different mixtures of polyvinyl acetate, or white glue, broax, and water, with the addition of shaving gel to create a fluffy slime.
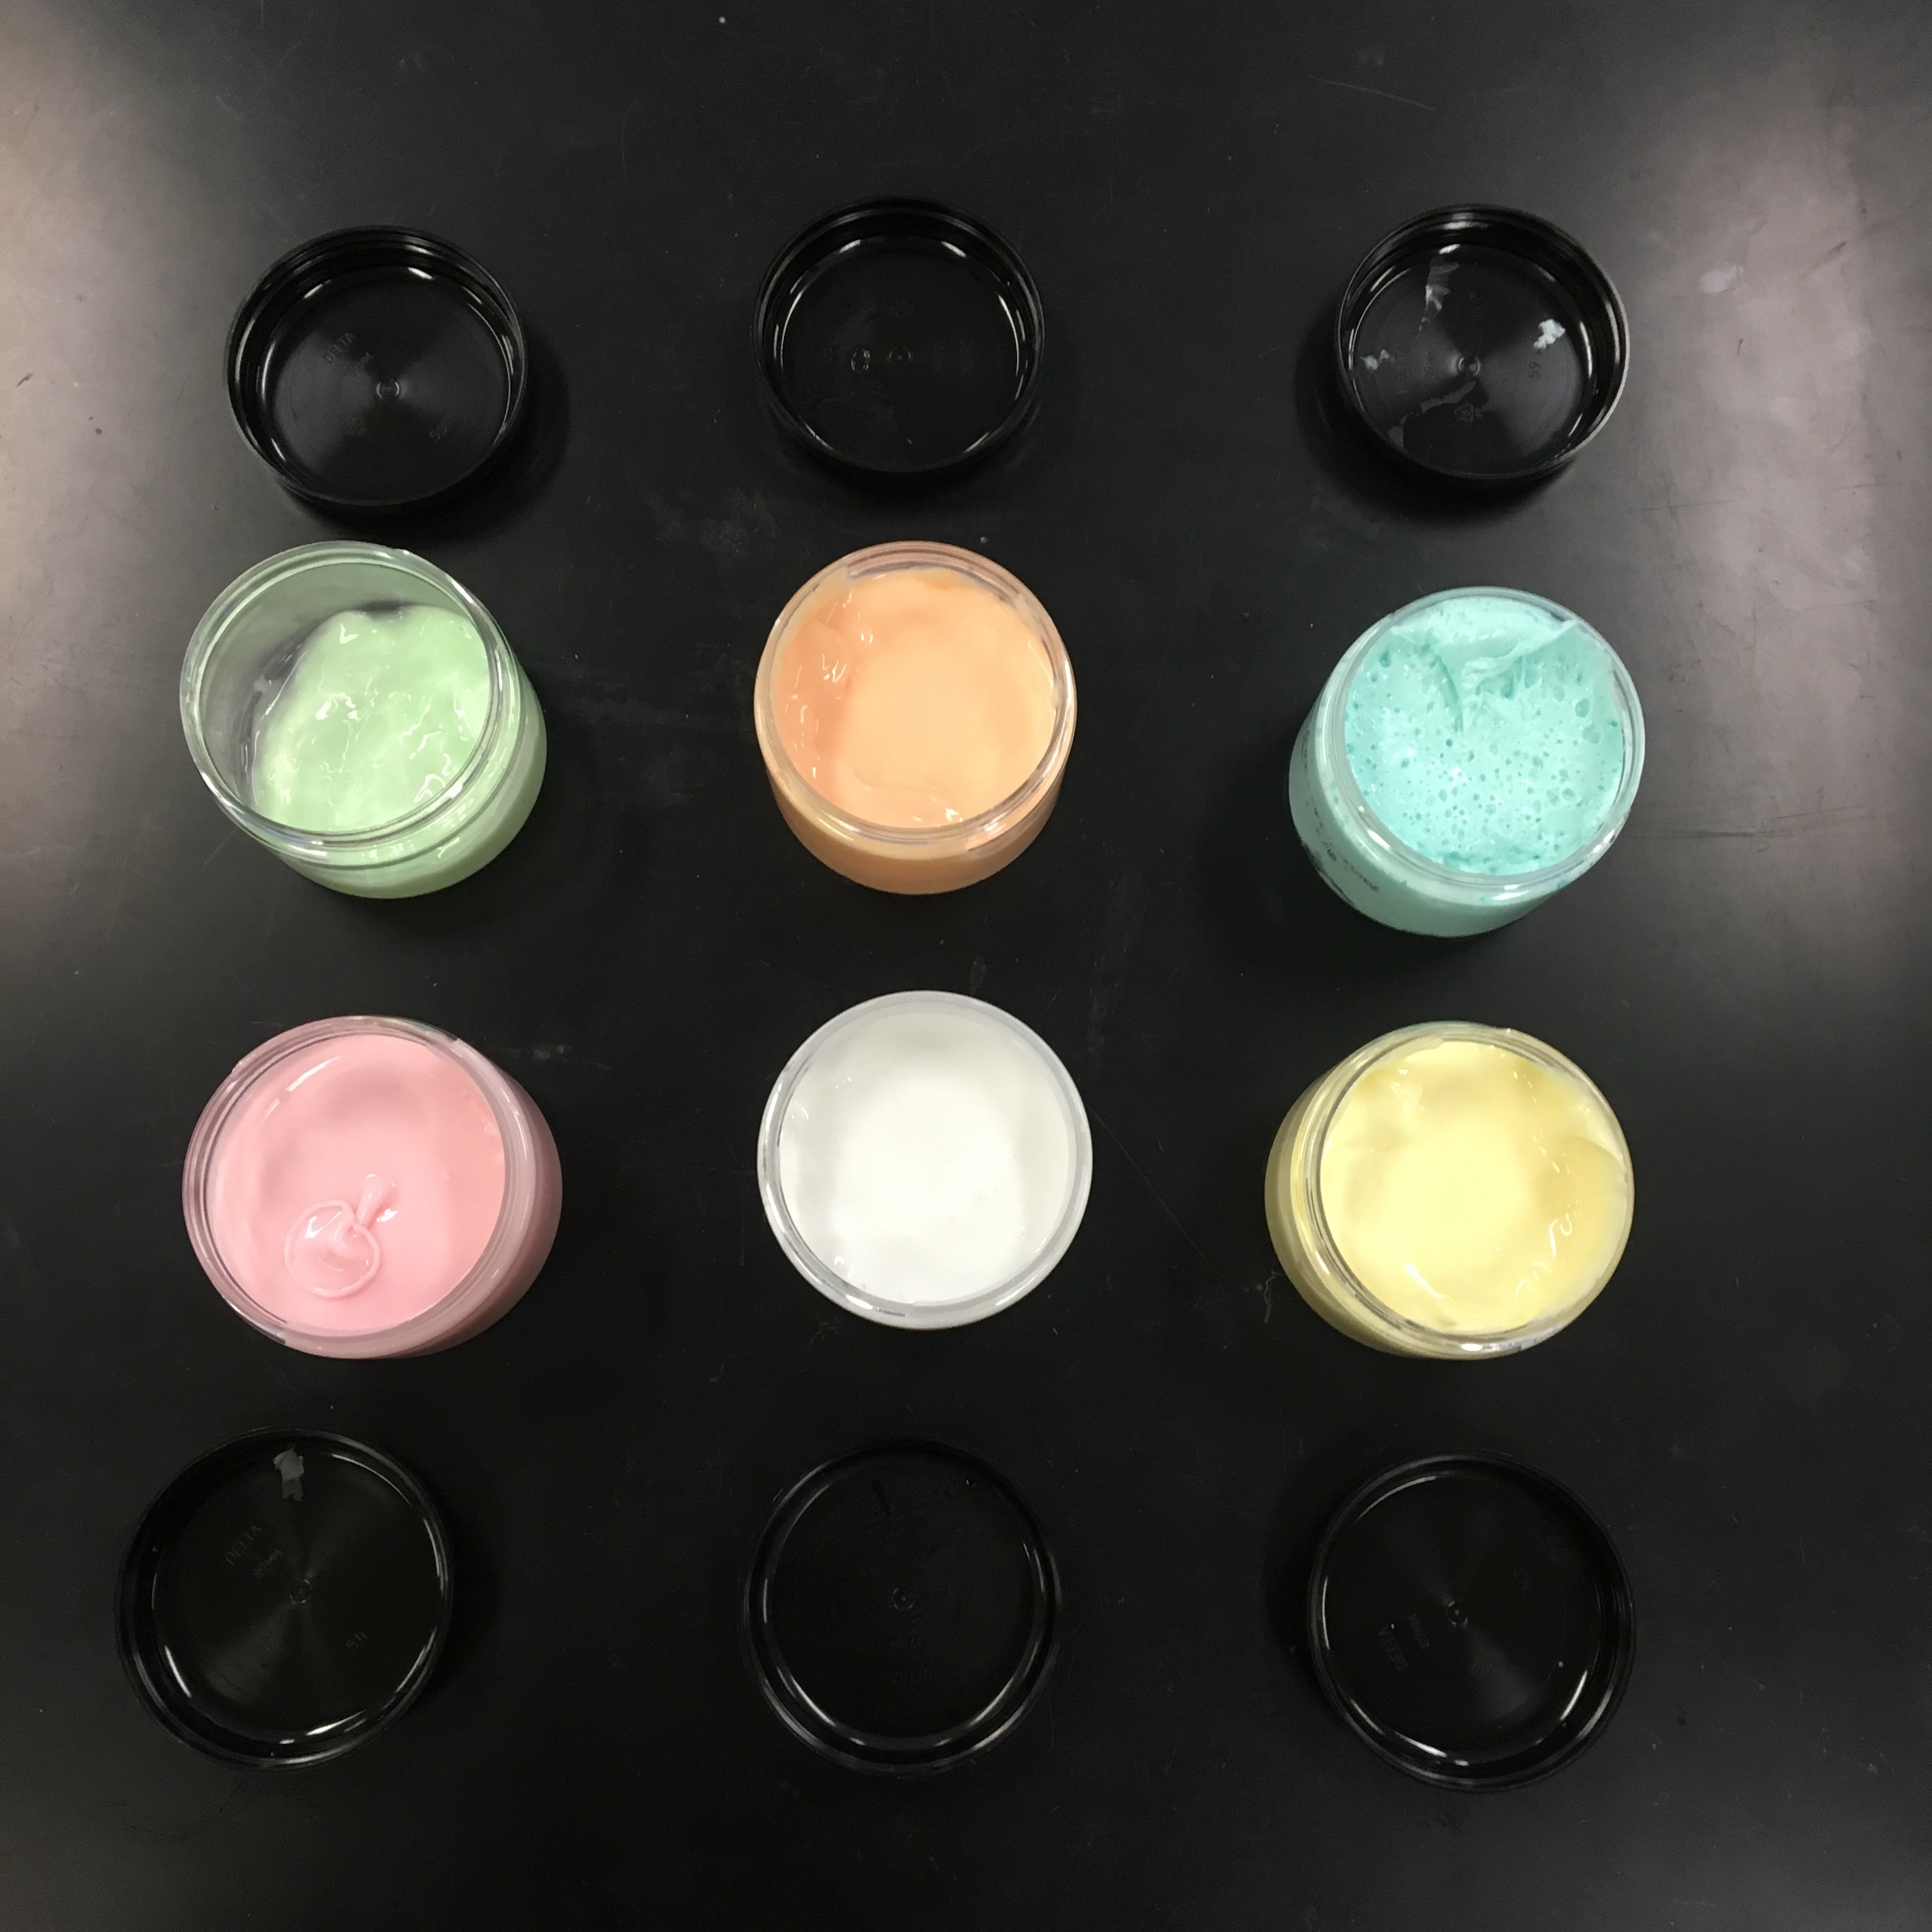
The slime was fun to play with, and it was noticeable that some samples were a lot more resistant to stretch and prone to snapping than others. However, by human touch alone it would be impossible to determine which composition yielded the stretchiest slime according to my metric. I knew that I had to analytically examine the data in order to get the results that I wanted. Most of the semester was a trial-and-error process to figure out the best strategy for analyzing that data.
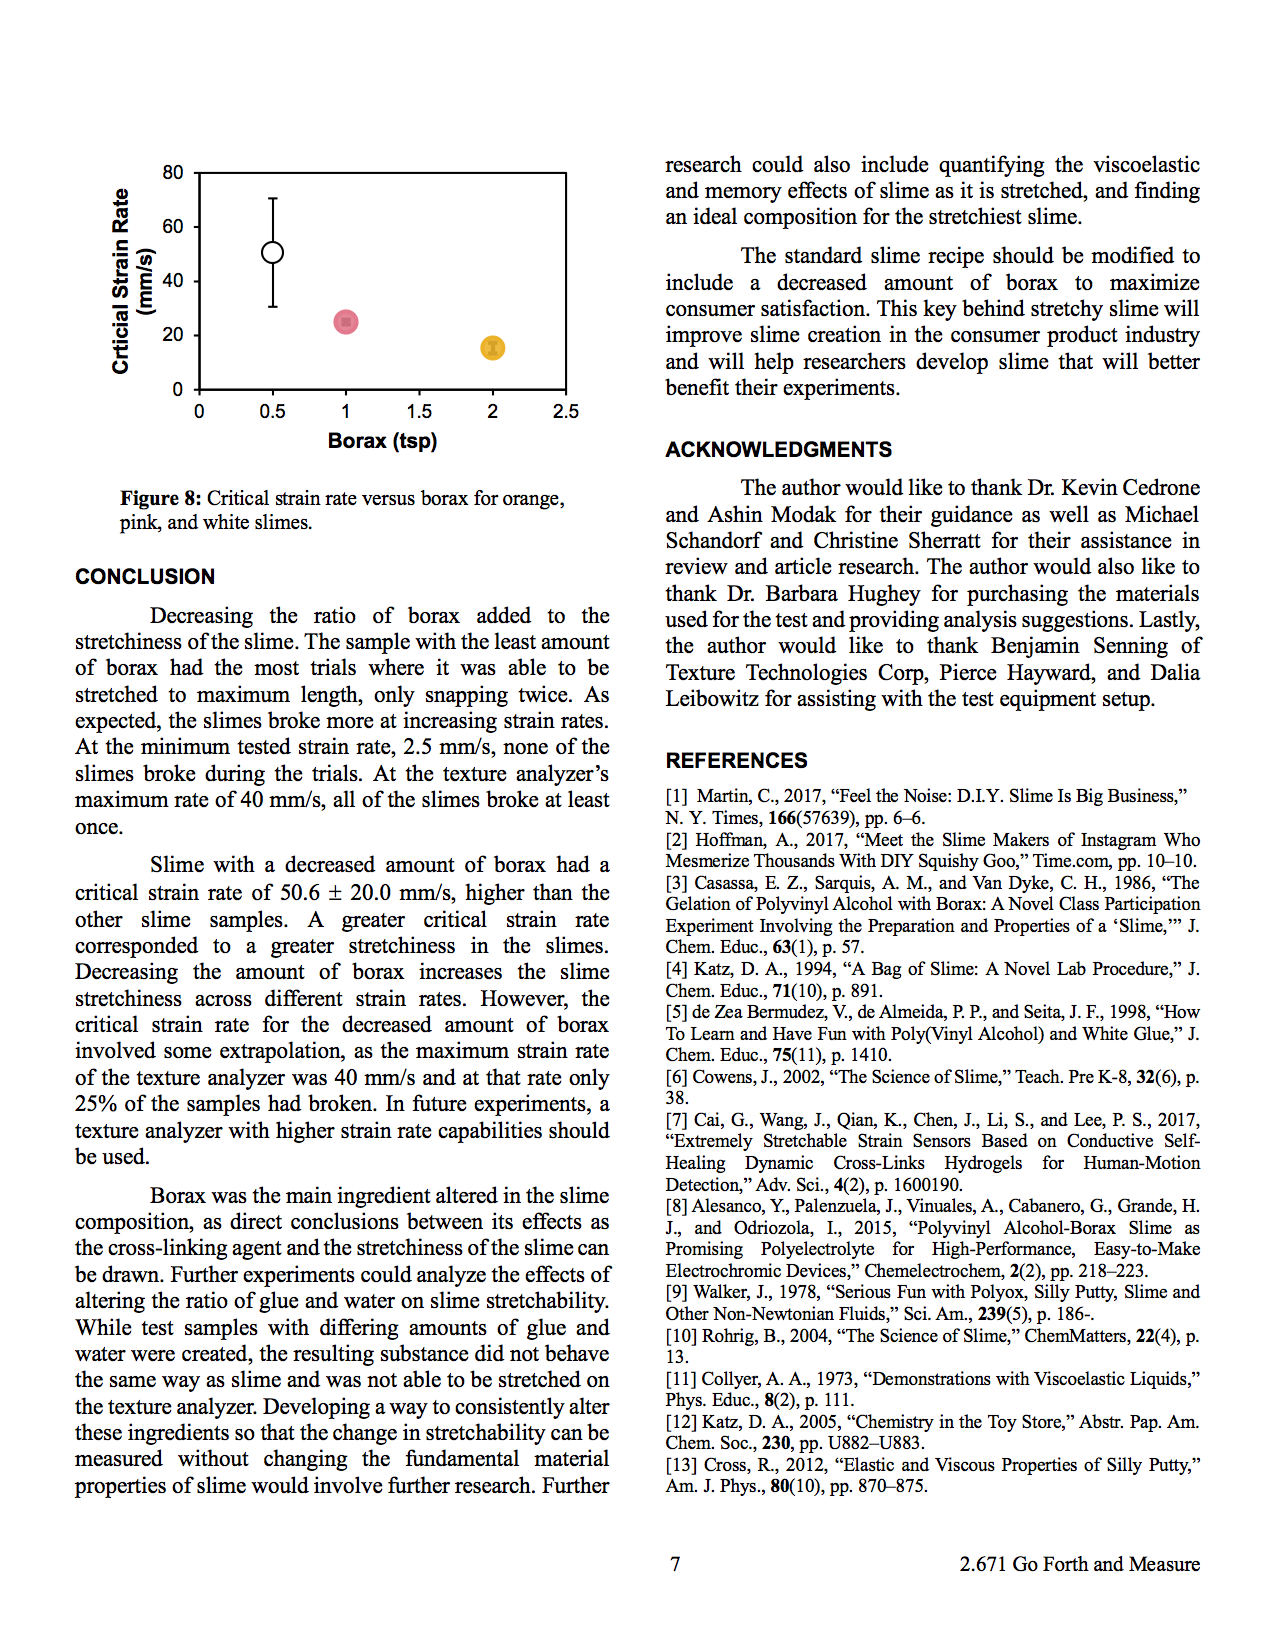
I used MATLAB to analyze the data from the generated force versus distance graphs to find the break lengths. Reading the graphs took a bit to get the hang of, but I essentially knew that the break point was when the texture analyzer was no longer exerting any force to pull the slime. I just needed to figure out a way to extract that point. Once I figured that out, it was simple to see from the results: the break point was simply the point at which the force magnitude rapidly decreased to zero. I analyzed the derivative of force in order to find this point, since we were looking for the maximum difference, or change in force.
I then created histograms of the distributions of break lengths for each strain rate. (I'd originally combined the strain rates created histograms for each composition alone, but realized that that gave me no useful information.) Now came the difficult part: how would I actually compare stretchiness? I would need a line of best fit of some sort, but the data wasn't linear, and the slope didn't make much sense. If I graphed the rate at which I pulled the slime during the test (mm/s) over break length (mm), I would get a slope with units of time (s). How exactly would that be interpreted in terms of stretchiness? I realized at that point that it wasn't enough to gather data: the hard part was the analysis, in which the data could be structured into something that would make more sense in terms of something a consumer.
After consulting with my advisor, I decided to abandon a linear fit. In order to compare stretchiness, I graphed the fraction of slimes that broke over the strain rate and fit the data to a sigmoidal function, or s-curve. This allowed me to find the critical strain rate, or the rate at which 50% of the slimes are predicted to break. I found that decreasing the amount of borax from the standard recommended slime recipe increased stretchiness. Further research can find the optimal amount of borax, as decreasing it entirely will result in no cross-linking of the polymer chains and thus no slime formation.
From this project, I was able to apply research to improve an existing consumer product. I learned how to pick an ideal quality of a product and to frame a research question around it, and then how to use existing engineering tools to collect and analyze data that will answer the question. I was able to use my analytical skills to structure a rigorous analysis from data that, at first glance, did not make the most sense.
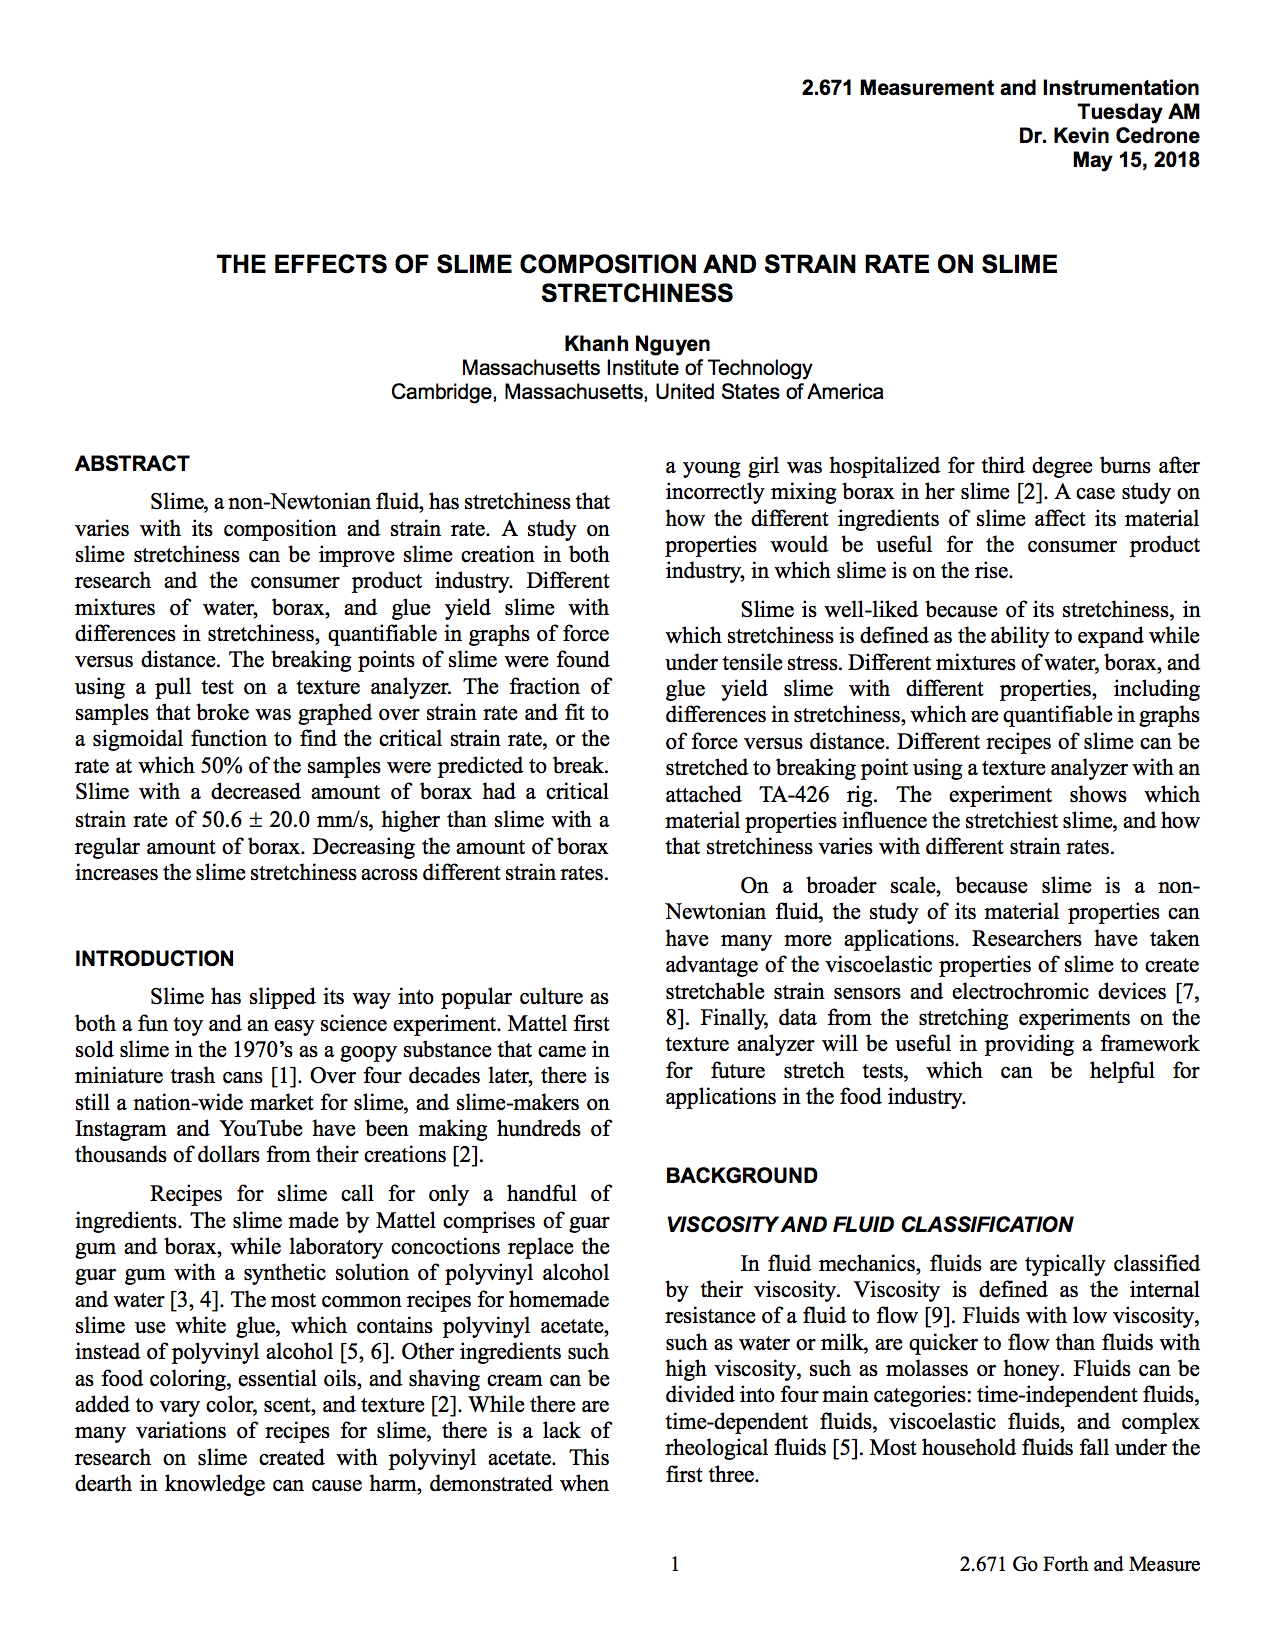
I synthesized my results into a poster that was presented at a poster session. I also wrote a research paper that can be found here. (Thumbnails of the first and last pages of the research paper and of the full poster are shown below.)