online culture survey
visualizing cultural issues among an online community
methods: ethnographic research, survey, qualitative research + coding, data analysis, data visualization, Excel, Power BI
tags: social media, online communities, DE&I (diversity, equity, and inclusion)
outputs: survey analysis, discussion guides for greater inclusion, conversations around rule changes
tags: social media, online communities, DE&I (diversity, equity, and inclusion)
outputs: survey analysis, discussion guides for greater inclusion, conversations around rule changes
background
I am part of an online creative writing community that consists of about 300 members. A couple of members and I noticed recurring themes and issues around the culture of the community, so we decided to release an anonymous survey polling the member base and curating insights. The result was a multiple question survey covering demographics, social issues, cliques, popularity, acceptance, and the impact of the COVID-19 pandemic. The survey garnered 100 responses, and we used this rich dataset to create graphs and analysis, culminating in a 75-slide magnum opus that we shared with the community to ignite discussion.
demographics100 responses out of 300 members
mostly white & female community, ages 20-30 |
methodssurvey + sentiment analysis published in 75-slide analysis
my main role: data cleansing & editing on Excel + data visualization on Power BI to visualize linkages |
powerBI dashboard filtering |
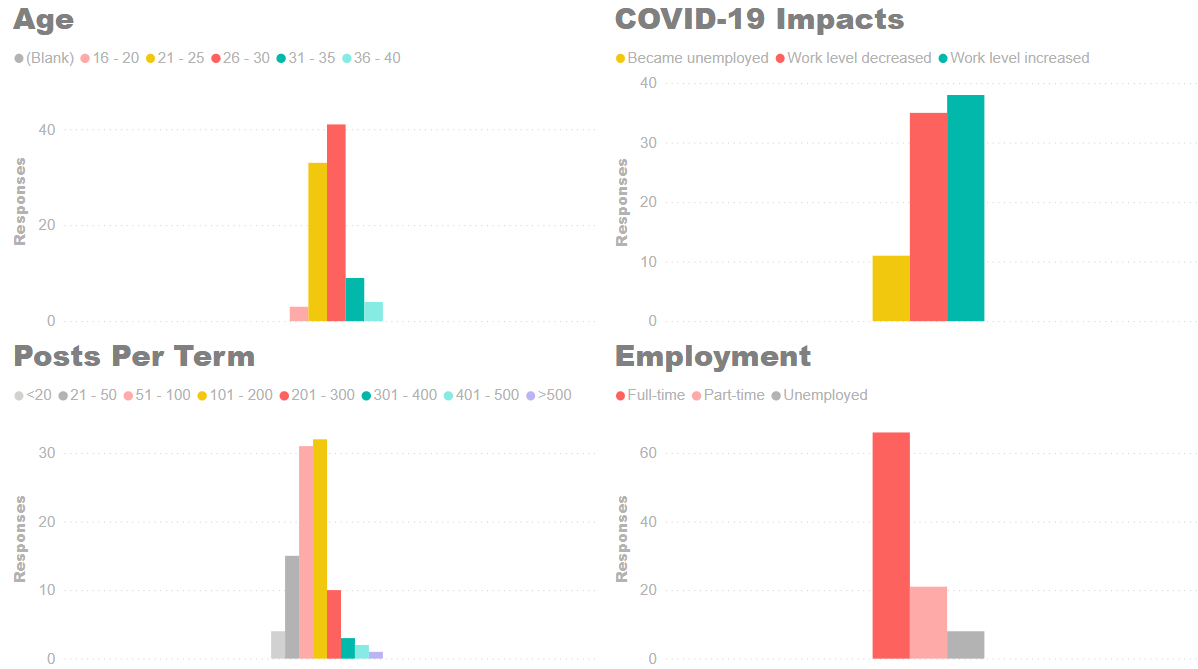
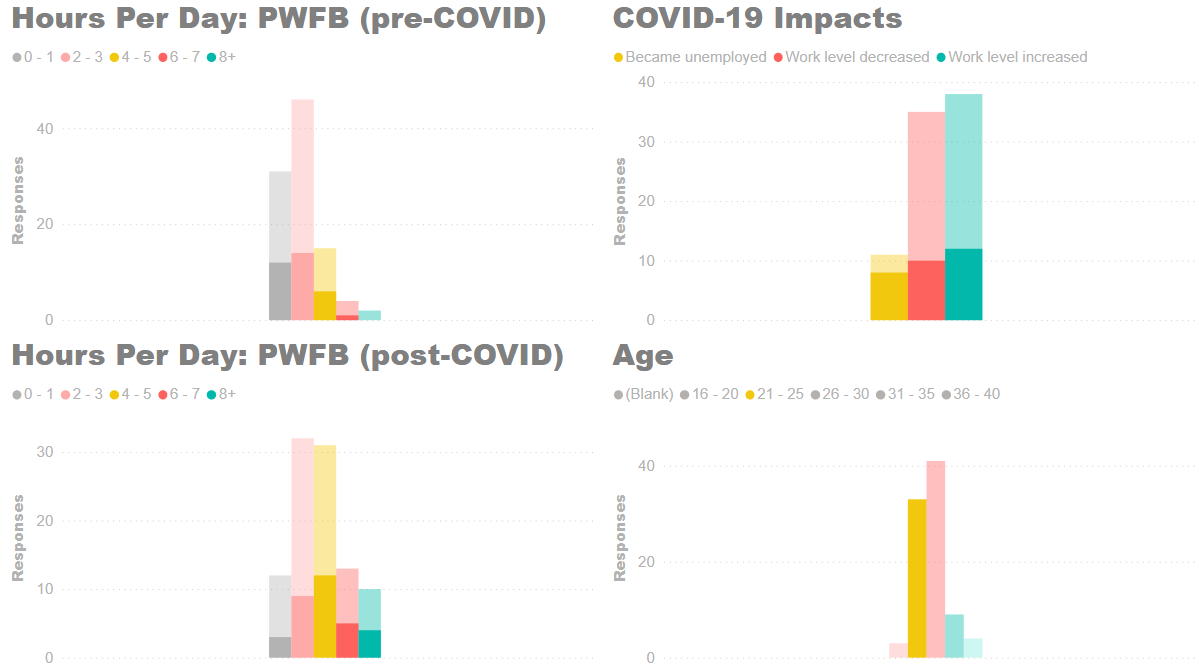
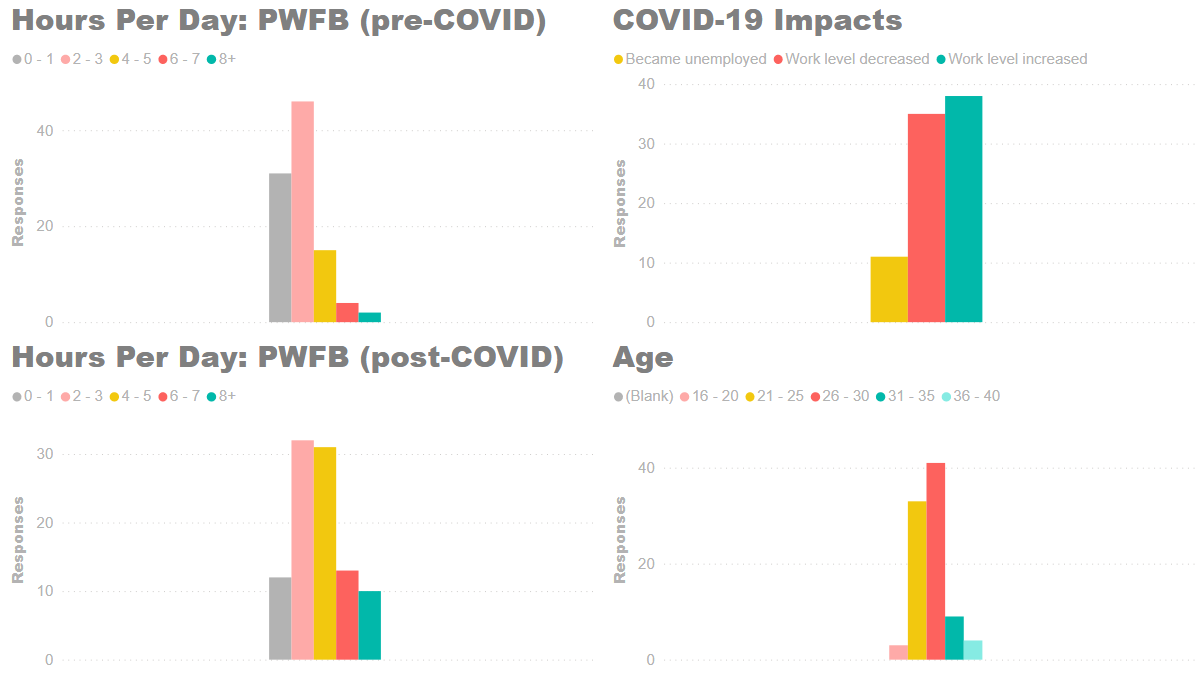
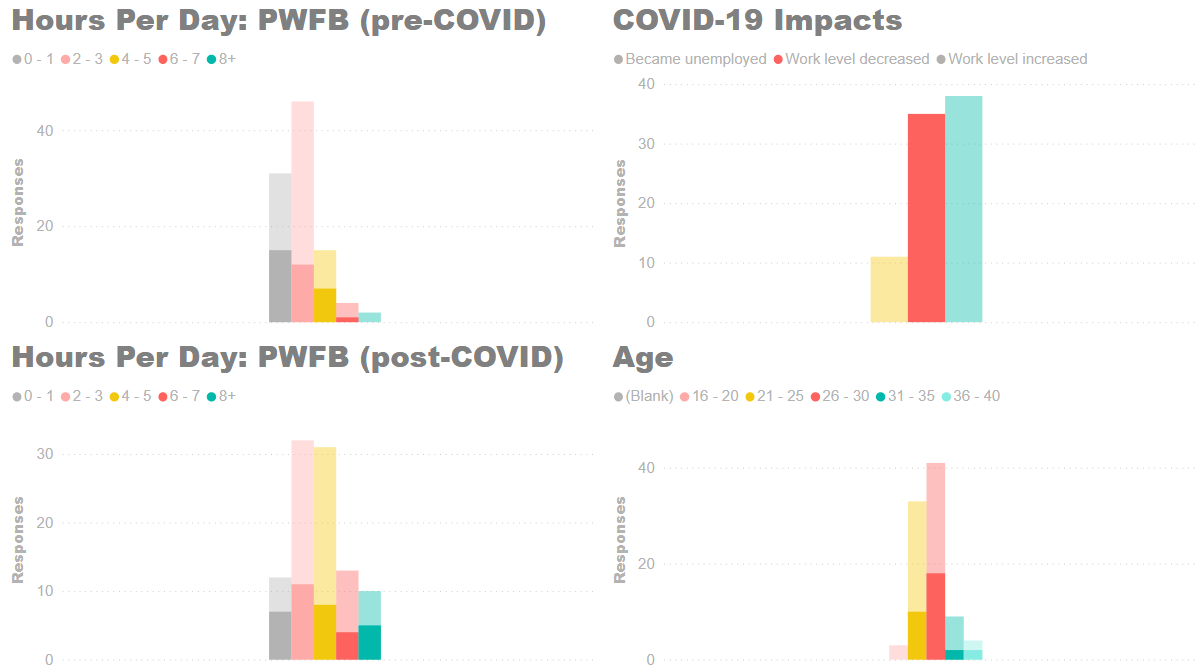
What I found interesting about Power BI was that charts on the same dashboard could be filtered by specific values on other charts. I created various dashboards to see associations.
For instance, the first row below shows the demographics and the activity level dashboards. In the second row, the activity level dashboard is filtered by a demographic slicer (21 - 25 age range) and by a specific response (work level decrease due to pandemic). The 21 - 25 age demographic mimicked the distributions most closely except for in COVID-19 impacts, where they were the majority of those who became unemployed. Could that be a selection bias? Or correlation due to other factors? We can't make any firm conclusions yet; they are simply interesting conversation starters that point to further spaces to explore. |
insights & analysis |
Once again, I shared my charts with the caveat that they had not been statistically verified and therefore no precise conclusions can be drawn, but the exploration of potential linkages was interesting.
|
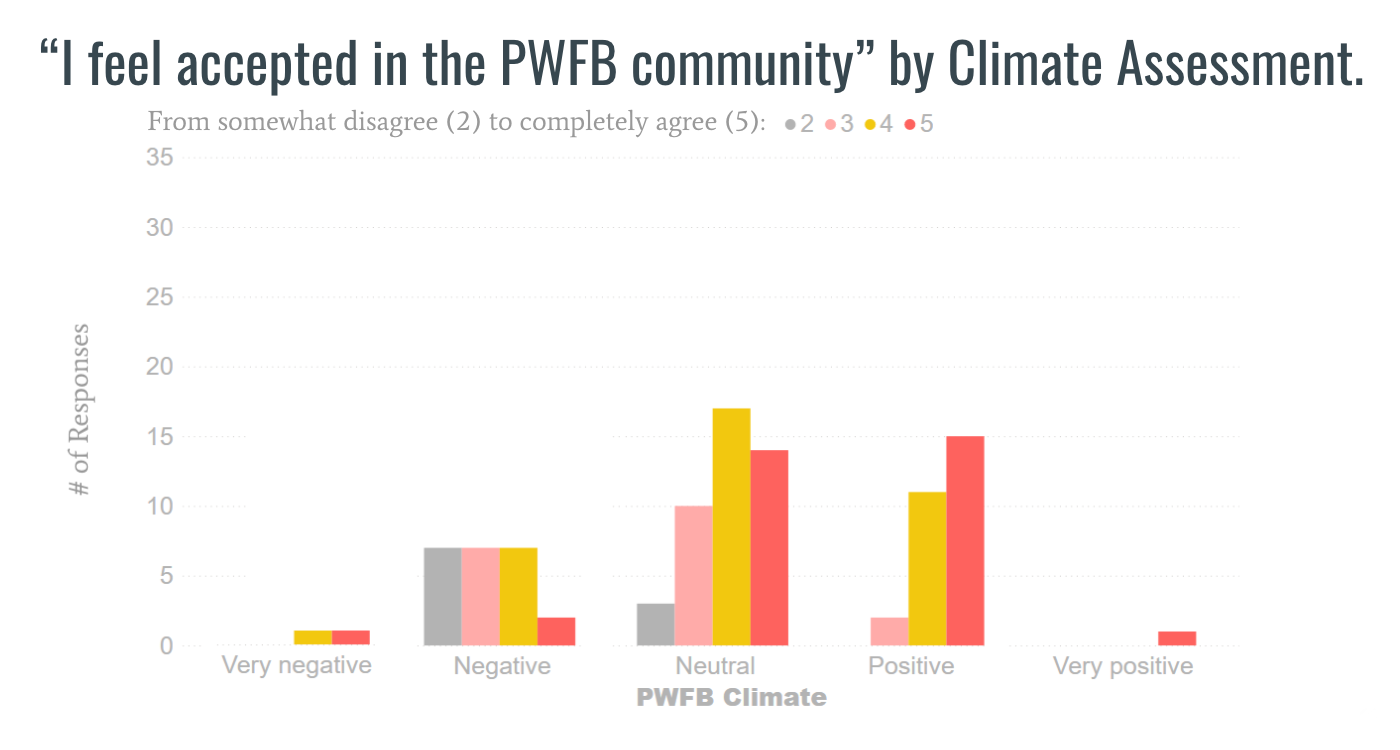
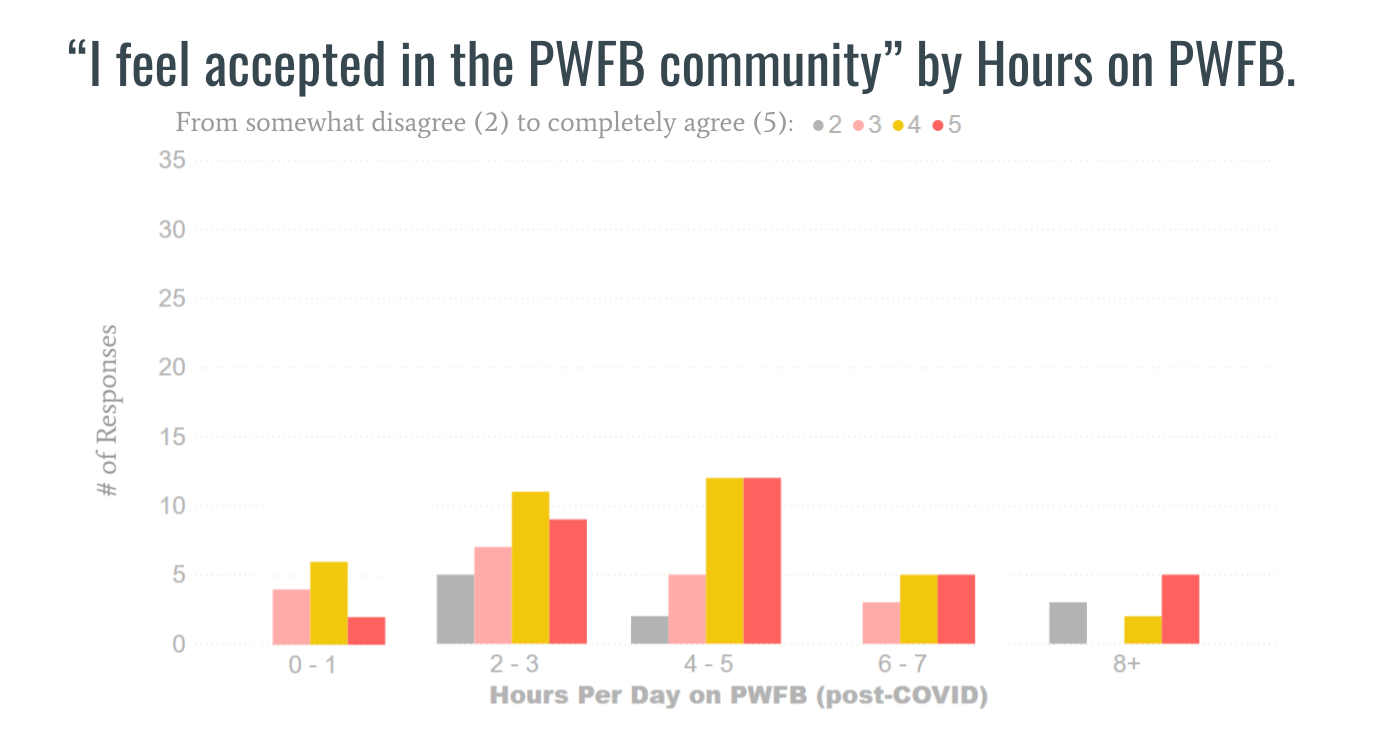
I juxtaposted the statement "I feel accepted in the community" with the assessment of the climate of the community (eg negative, neutral, positive) and to number of hours spent on the site. Respondents who stated that the climate was neutral to very positive were more likely to completely agree that they felt accepted in the community: this seems obvious. The opposite was also true. What was interesting, though, responses that rated the climate as 'very negative' also agreed that they felt accepted in the community. This could be because of cliques: they feel accepted in their pocket of the community but have a negative view of the community at large.
In terms of number of hours spent on the site, it was clearly more polarizing: the longer spent on the site, the more likely responses would gravitate towards the extremes of whether or not they felt accepted.
In terms of number of hours spent on the site, it was clearly more polarizing: the longer spent on the site, the more likely responses would gravitate towards the extremes of whether or not they felt accepted.
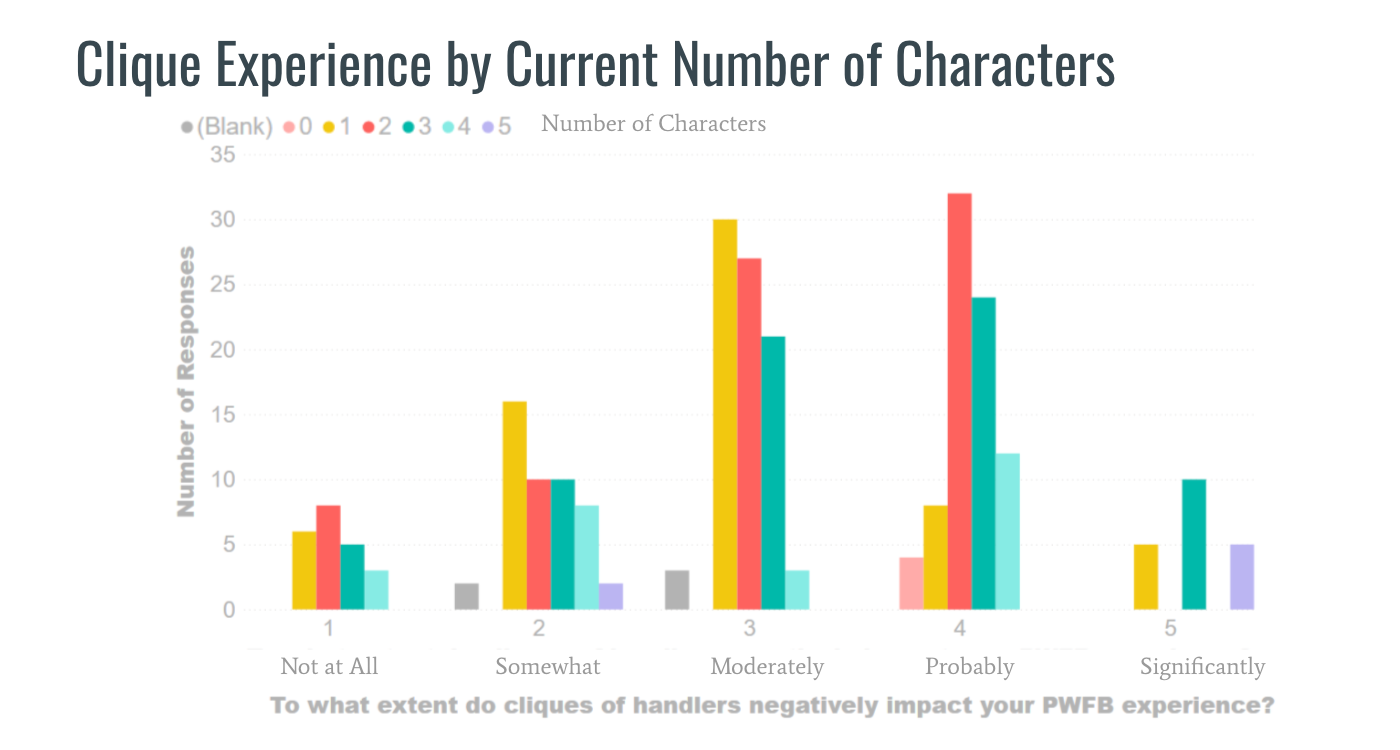
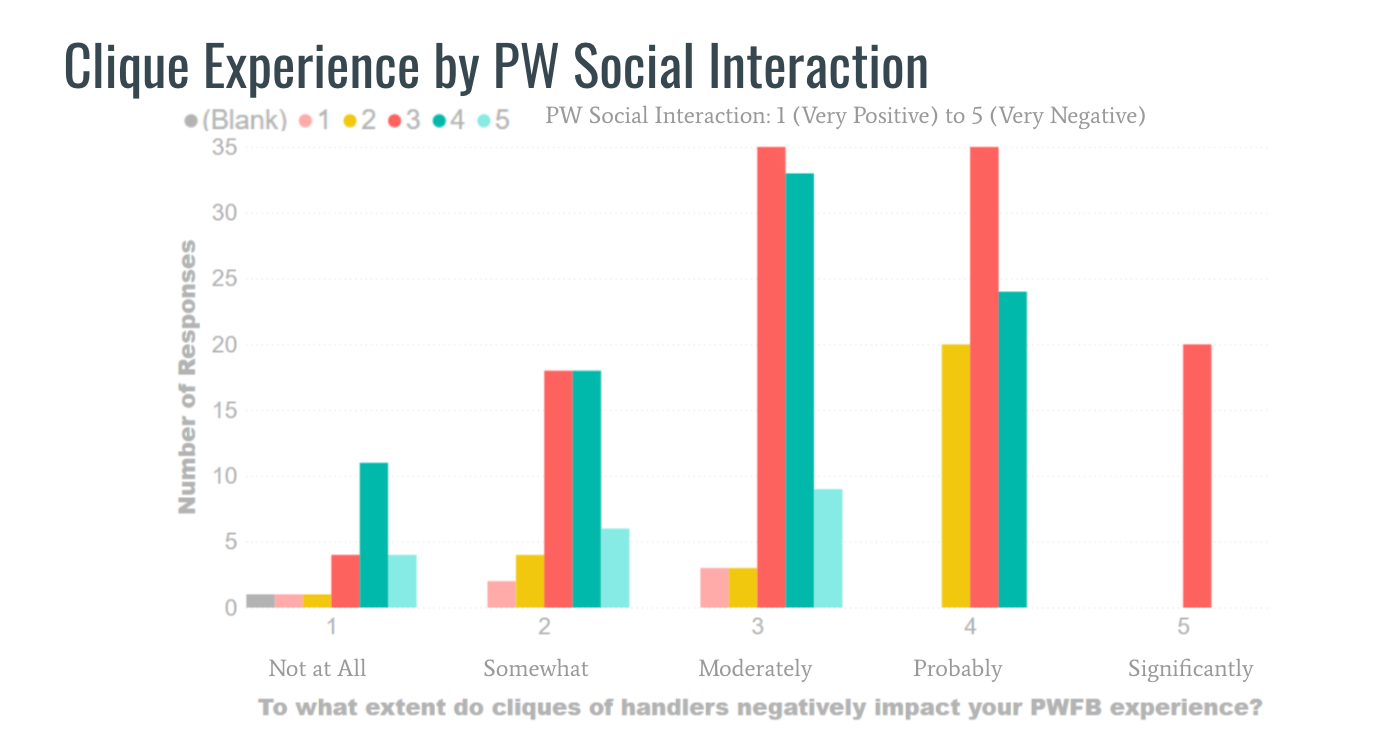
I next wanted to break down the users who said they had experiences with cliques, a much debated topic in our community. The question asked was "To what extent to cliques negatively impact your experience?"
Most of those who felt their experience was significantly impacted by cliques actually rated their social interaction as neutral, instead of more negative -- while the more negative responses seemed to have less to do with the interaction of cliques. This highlighted a misconception and another area to explore: what other things are contributing to a negative community experience?
Most of those who felt their experience was significantly impacted by cliques actually rated their social interaction as neutral, instead of more negative -- while the more negative responses seemed to have less to do with the interaction of cliques. This highlighted a misconception and another area to explore: what other things are contributing to a negative community experience?
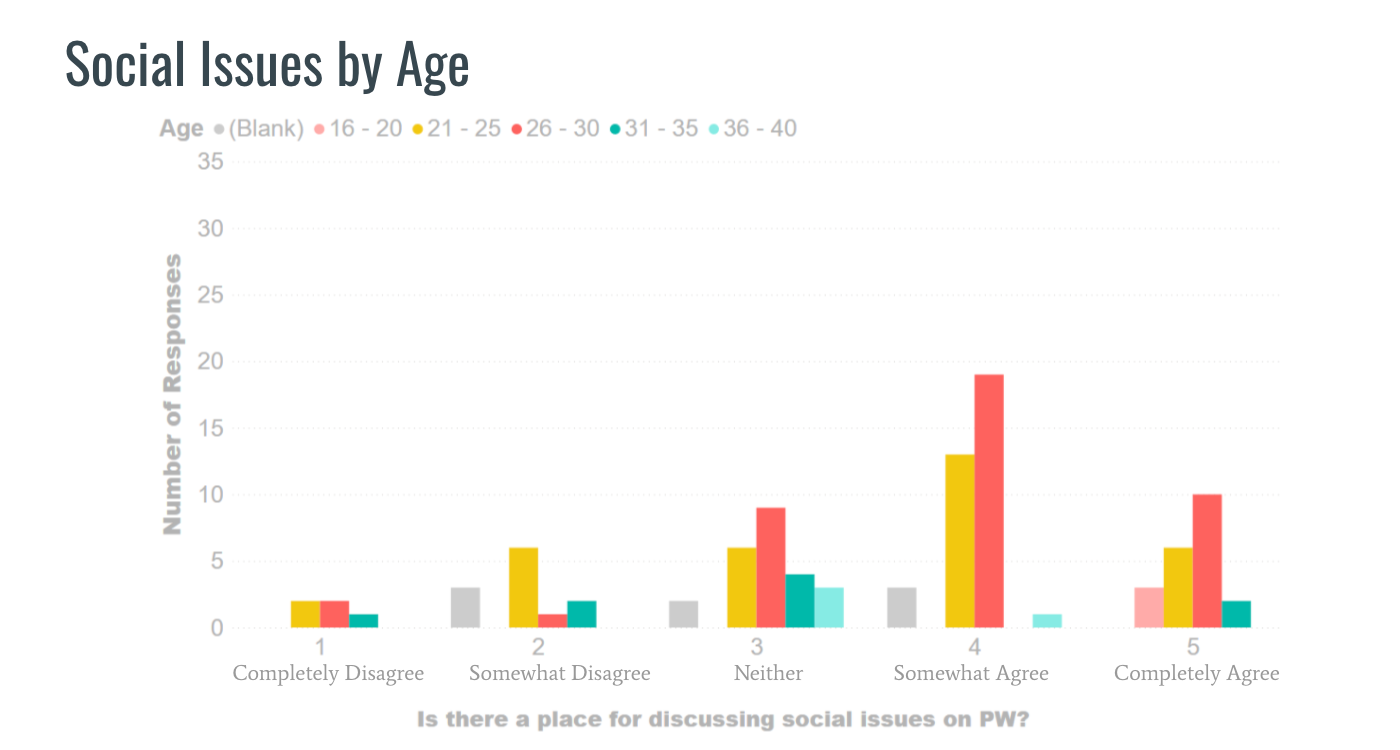
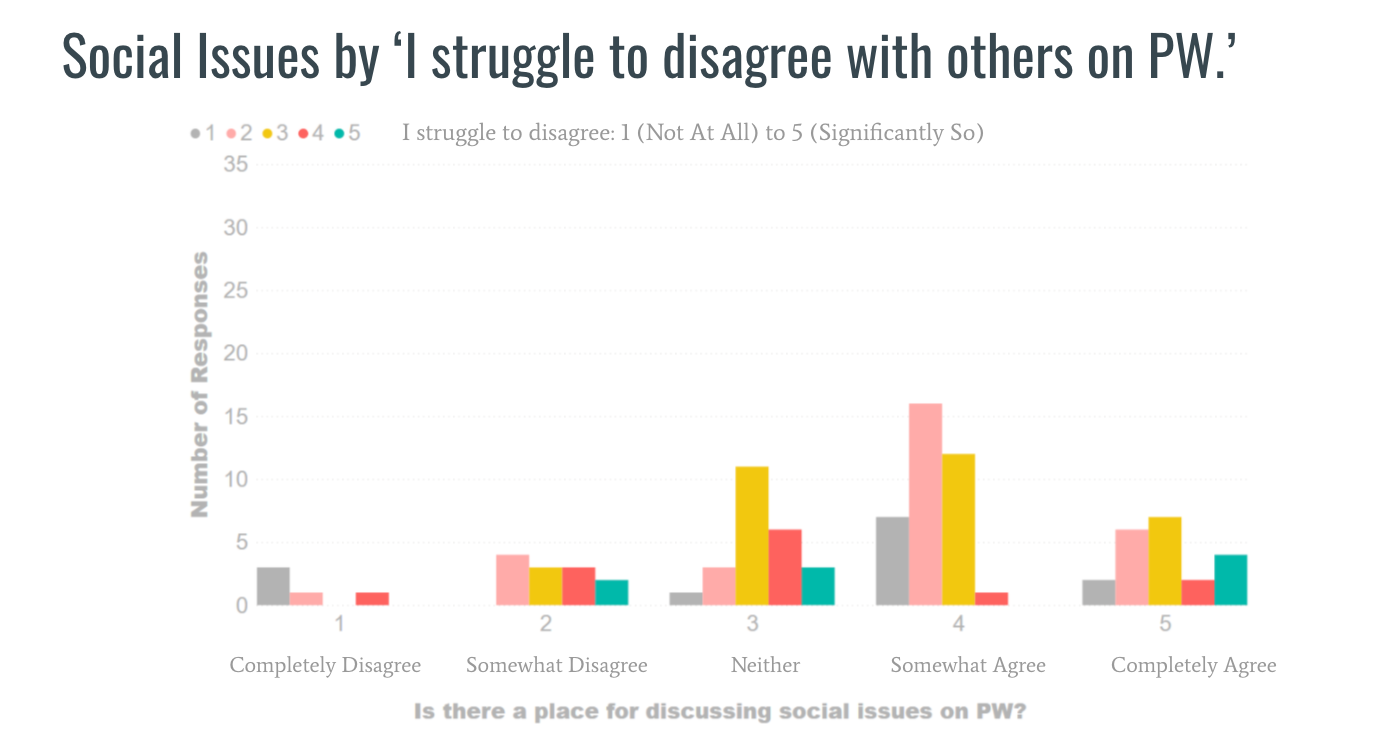
Finally, I was interested in the responses to the question "Is there a place for discussing social issues on the site?" Social issues refers to issues regarding race, religion, gender, current events, et cetera -- things that could be beyond the scope of the site, but do influence community dynamics. I wanted to see how age and temperament came into play. In general, respondents skewed towards receptivity to discussing social issues.
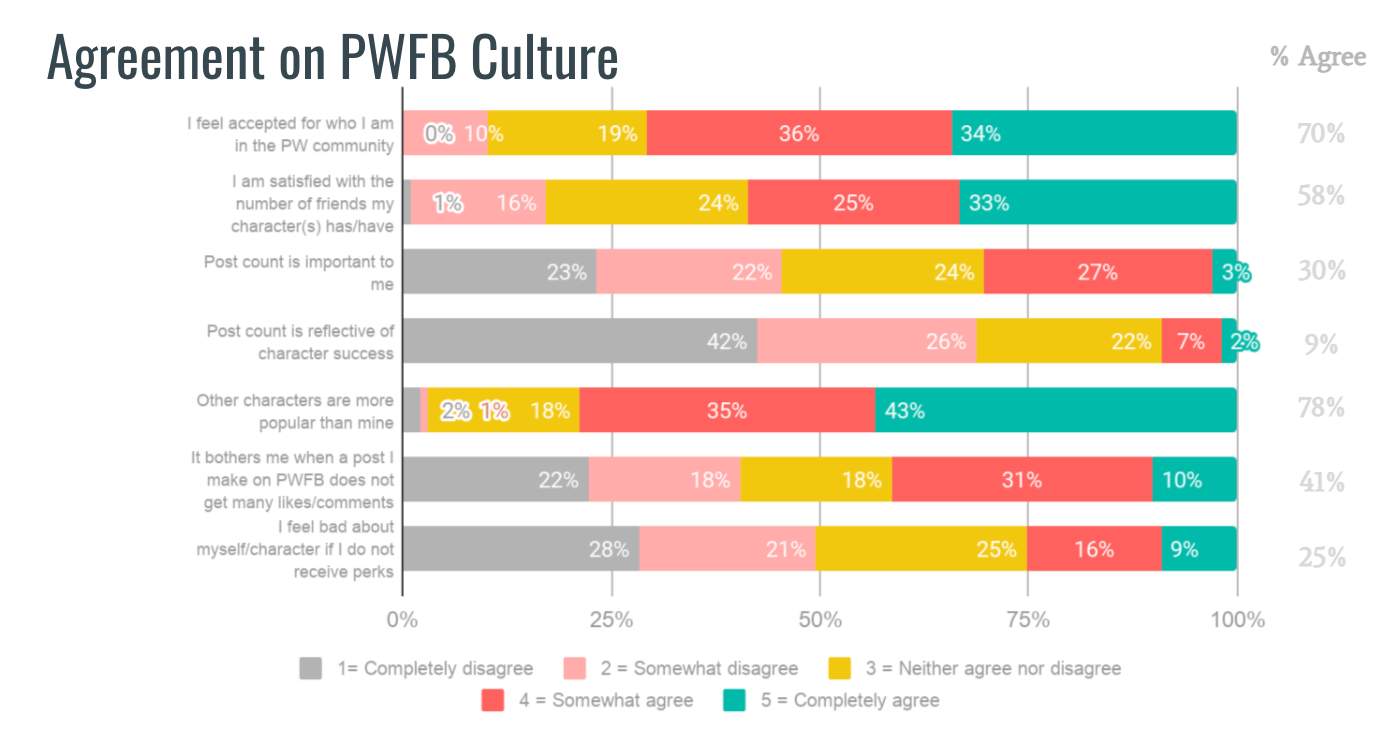
stoplight chart showing different answers to survey statements on culture
results |
Overall, the project was a fascinating study on the socialization and relationships established within a medium-sized online community and a combination of my interests in social & behavioral science and data visualization. I understand that the questions I chose to highlight could have biases, but I selected them to showcase issues that the group determined they wanted to talk about.
As a result of the survey, conversations opened up on the site about various sensitive topics, especially in regards to social issues. It showed people that the majority of users, for example, were white and identified as female, though they were writing characters of different races and genders. One direct result of this was the creation of a guide for writing characters of different cultures that would allow for more inclusive characterization. Other results of this survey were the staff opening up discussions and ultimately rule changes for different social issues, including the ability to sensitively write transgender and disabled characters. |

