material property measurement and analysis
methods: market research, literature review, product + material testing, quantitative analysis, MATLAB coding
tags: slime, consumer products, experiments, working with ambiguity
outputs: research paper, presentation at MIT engineering symposium
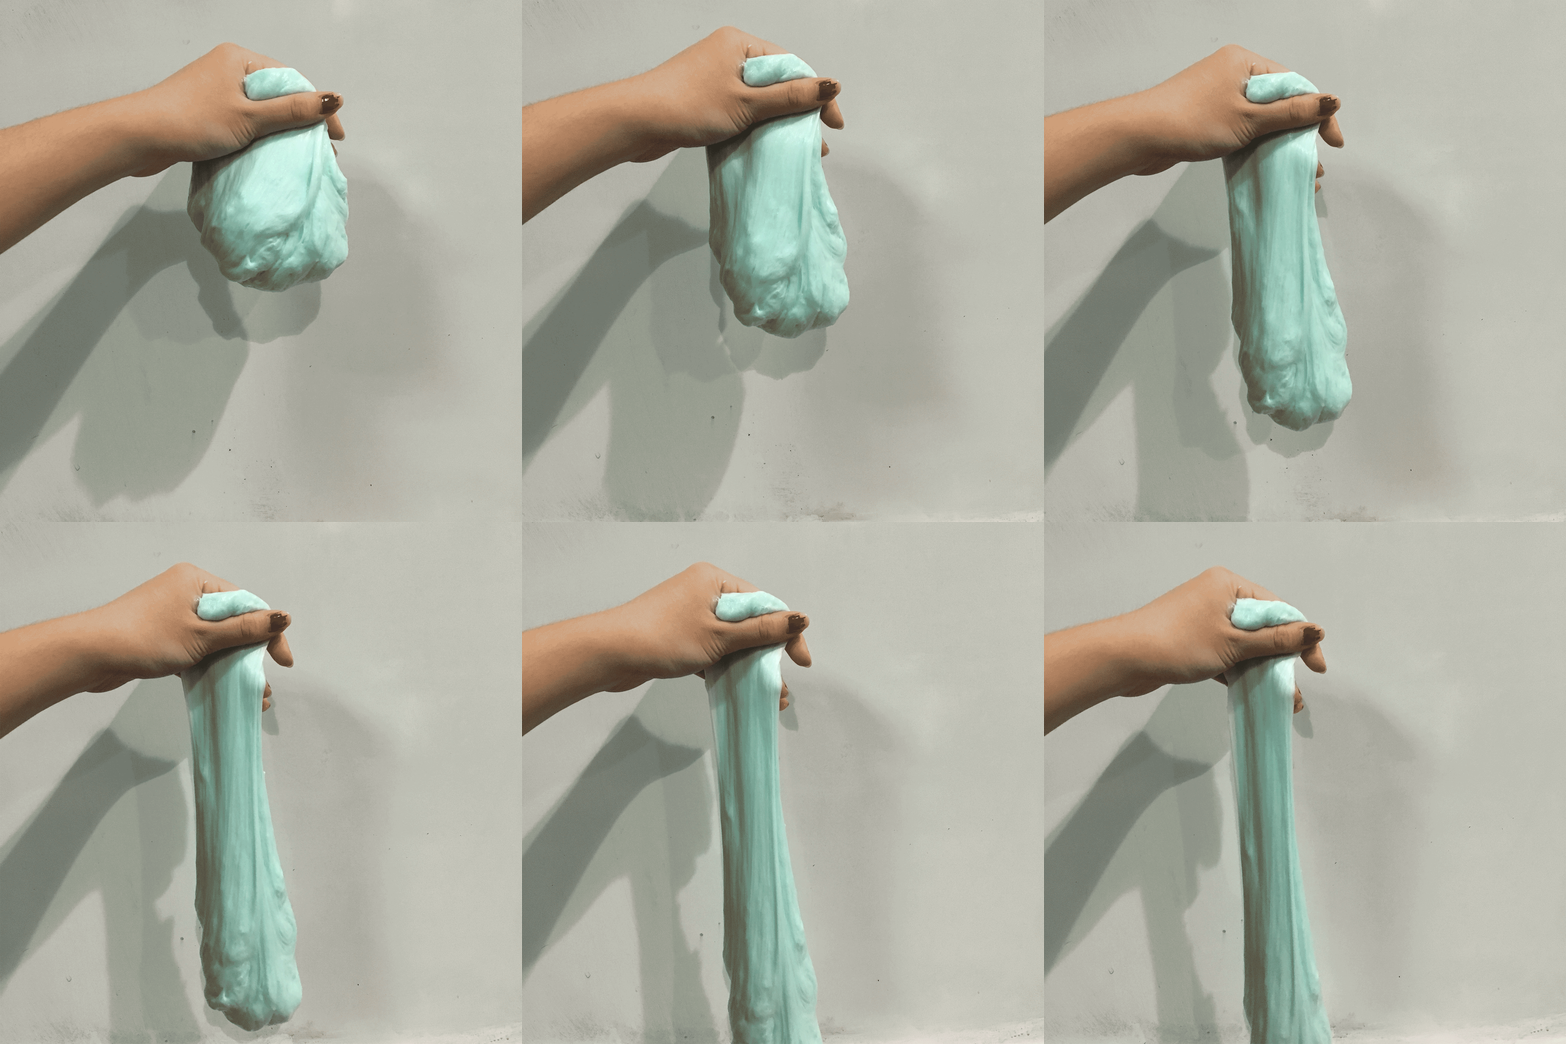
Slime is a non-Newtonian fluid, meaning it has complex material properties that defy typical laws of viscosity that scientists are still trying to understand. I conducted a research project on slime stretchiness, cumulating in a research paper and poster presented at an engineering symposium. This was an individual research project as part of MIT mechanical engineering.
What makes slime appealing to consumers, and what makes it an interesting study for science, is the material property of 'stretchiness'. My goal was to optimize slime stretchiness and to discover how altering the slime composition and strain rate affects stretchiness.

Stretchiness has no standardized method of measurement. I needed to extract a method from the madness.
My first step in the process was to define stretchiness for the purposes I needed. (I settled on "the ability to expand while under tensile stress.")
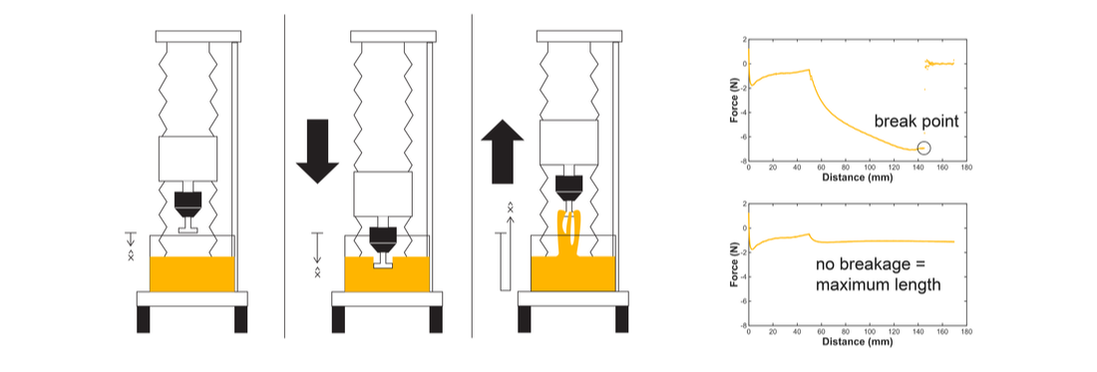
I needed to figure out how to test that stretchiness. I settled on using a stretch test on a texture analyzer, a machine that is usually used to do experiments on food in industry settings. Stretch tests aren't the most common types of tests conducted on the texture analyzer, so creating the test and analyzing the parameters was also a trial and error process. I was able to chat with someone working at the Texture Technologies Corp, who helped me discern which built-in programs I could modify for my experiment.
The premise of the test: stretch samples on the lab's texture analyzer at different strain rates and noted down when they broke.

I had to develop the slime samples I wanted to run tests on. Standard recipes for slime (of which I perused many) involved different concentrations of polyvinyl acetate, or white glue, borax, and water. There were also recipes that called for the addition of shaving gel to create fluffy slimes.
I created six different samples of slime, and tested the four that would give me the widest range of results.
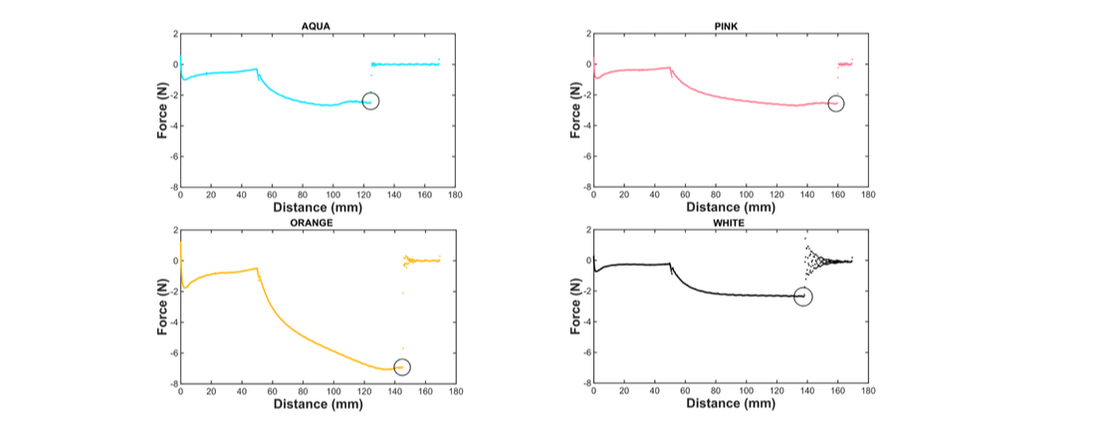
I was excited to analyze the data that the texture analyzer collected, rich datasets that came in the form of several huge CSV files. I structured the data force versus distance graphs in MATLAB. Then I paused. How do I extract a break point from a force versus distance graph? What did that even mean? This was the inverse of engineering word problems in which, during a unit learning about a specific formula, we are given problems to apply it to the real world. Here, I had a real world problem that I needed to assign a mathematical concept to.
My advisor and I figured out the break point was when the texture analyzer was no longer exerting any force to pull the slime. This meant break point was simply the point at which the force magnitude rapidly decreased to zero. I was looking for the maximum change in force: in other words, a derivative. I wrote that into my code to perform the analysis.
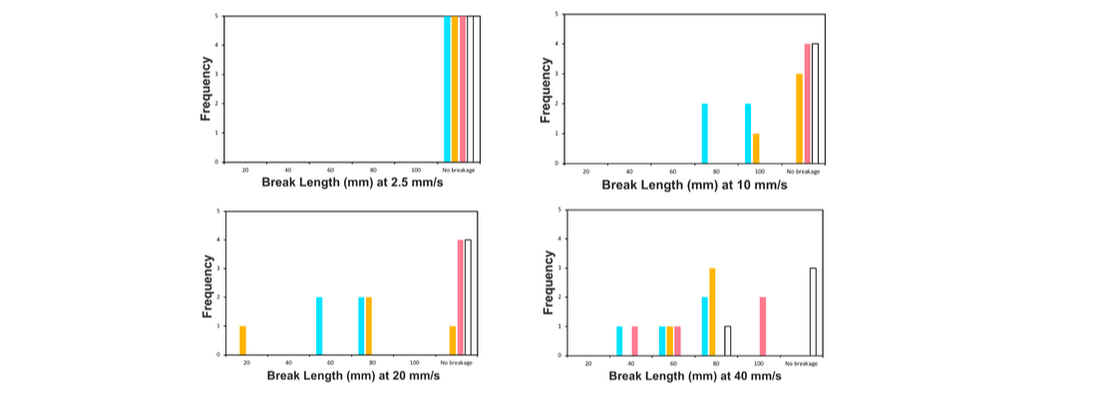
I then created histograms of the distributions of break lengths for each strain rate. Now came another sticking point: how would I actually compare stretchiness? I would need a line of best fit of some sort, but the data wasn't linear, and the slope didn't make much sense. If I graphed the rate at which I pulled the slime during the test (mm/s) over break length (mm), I would get a slope with units of time (s). How exactly would that be interpreted in terms of stretchiness? I realized at that point that it wasn't enough to gather data: the hard part was the analysis, in which the data could be structured into something that would make more sense for a consumer.
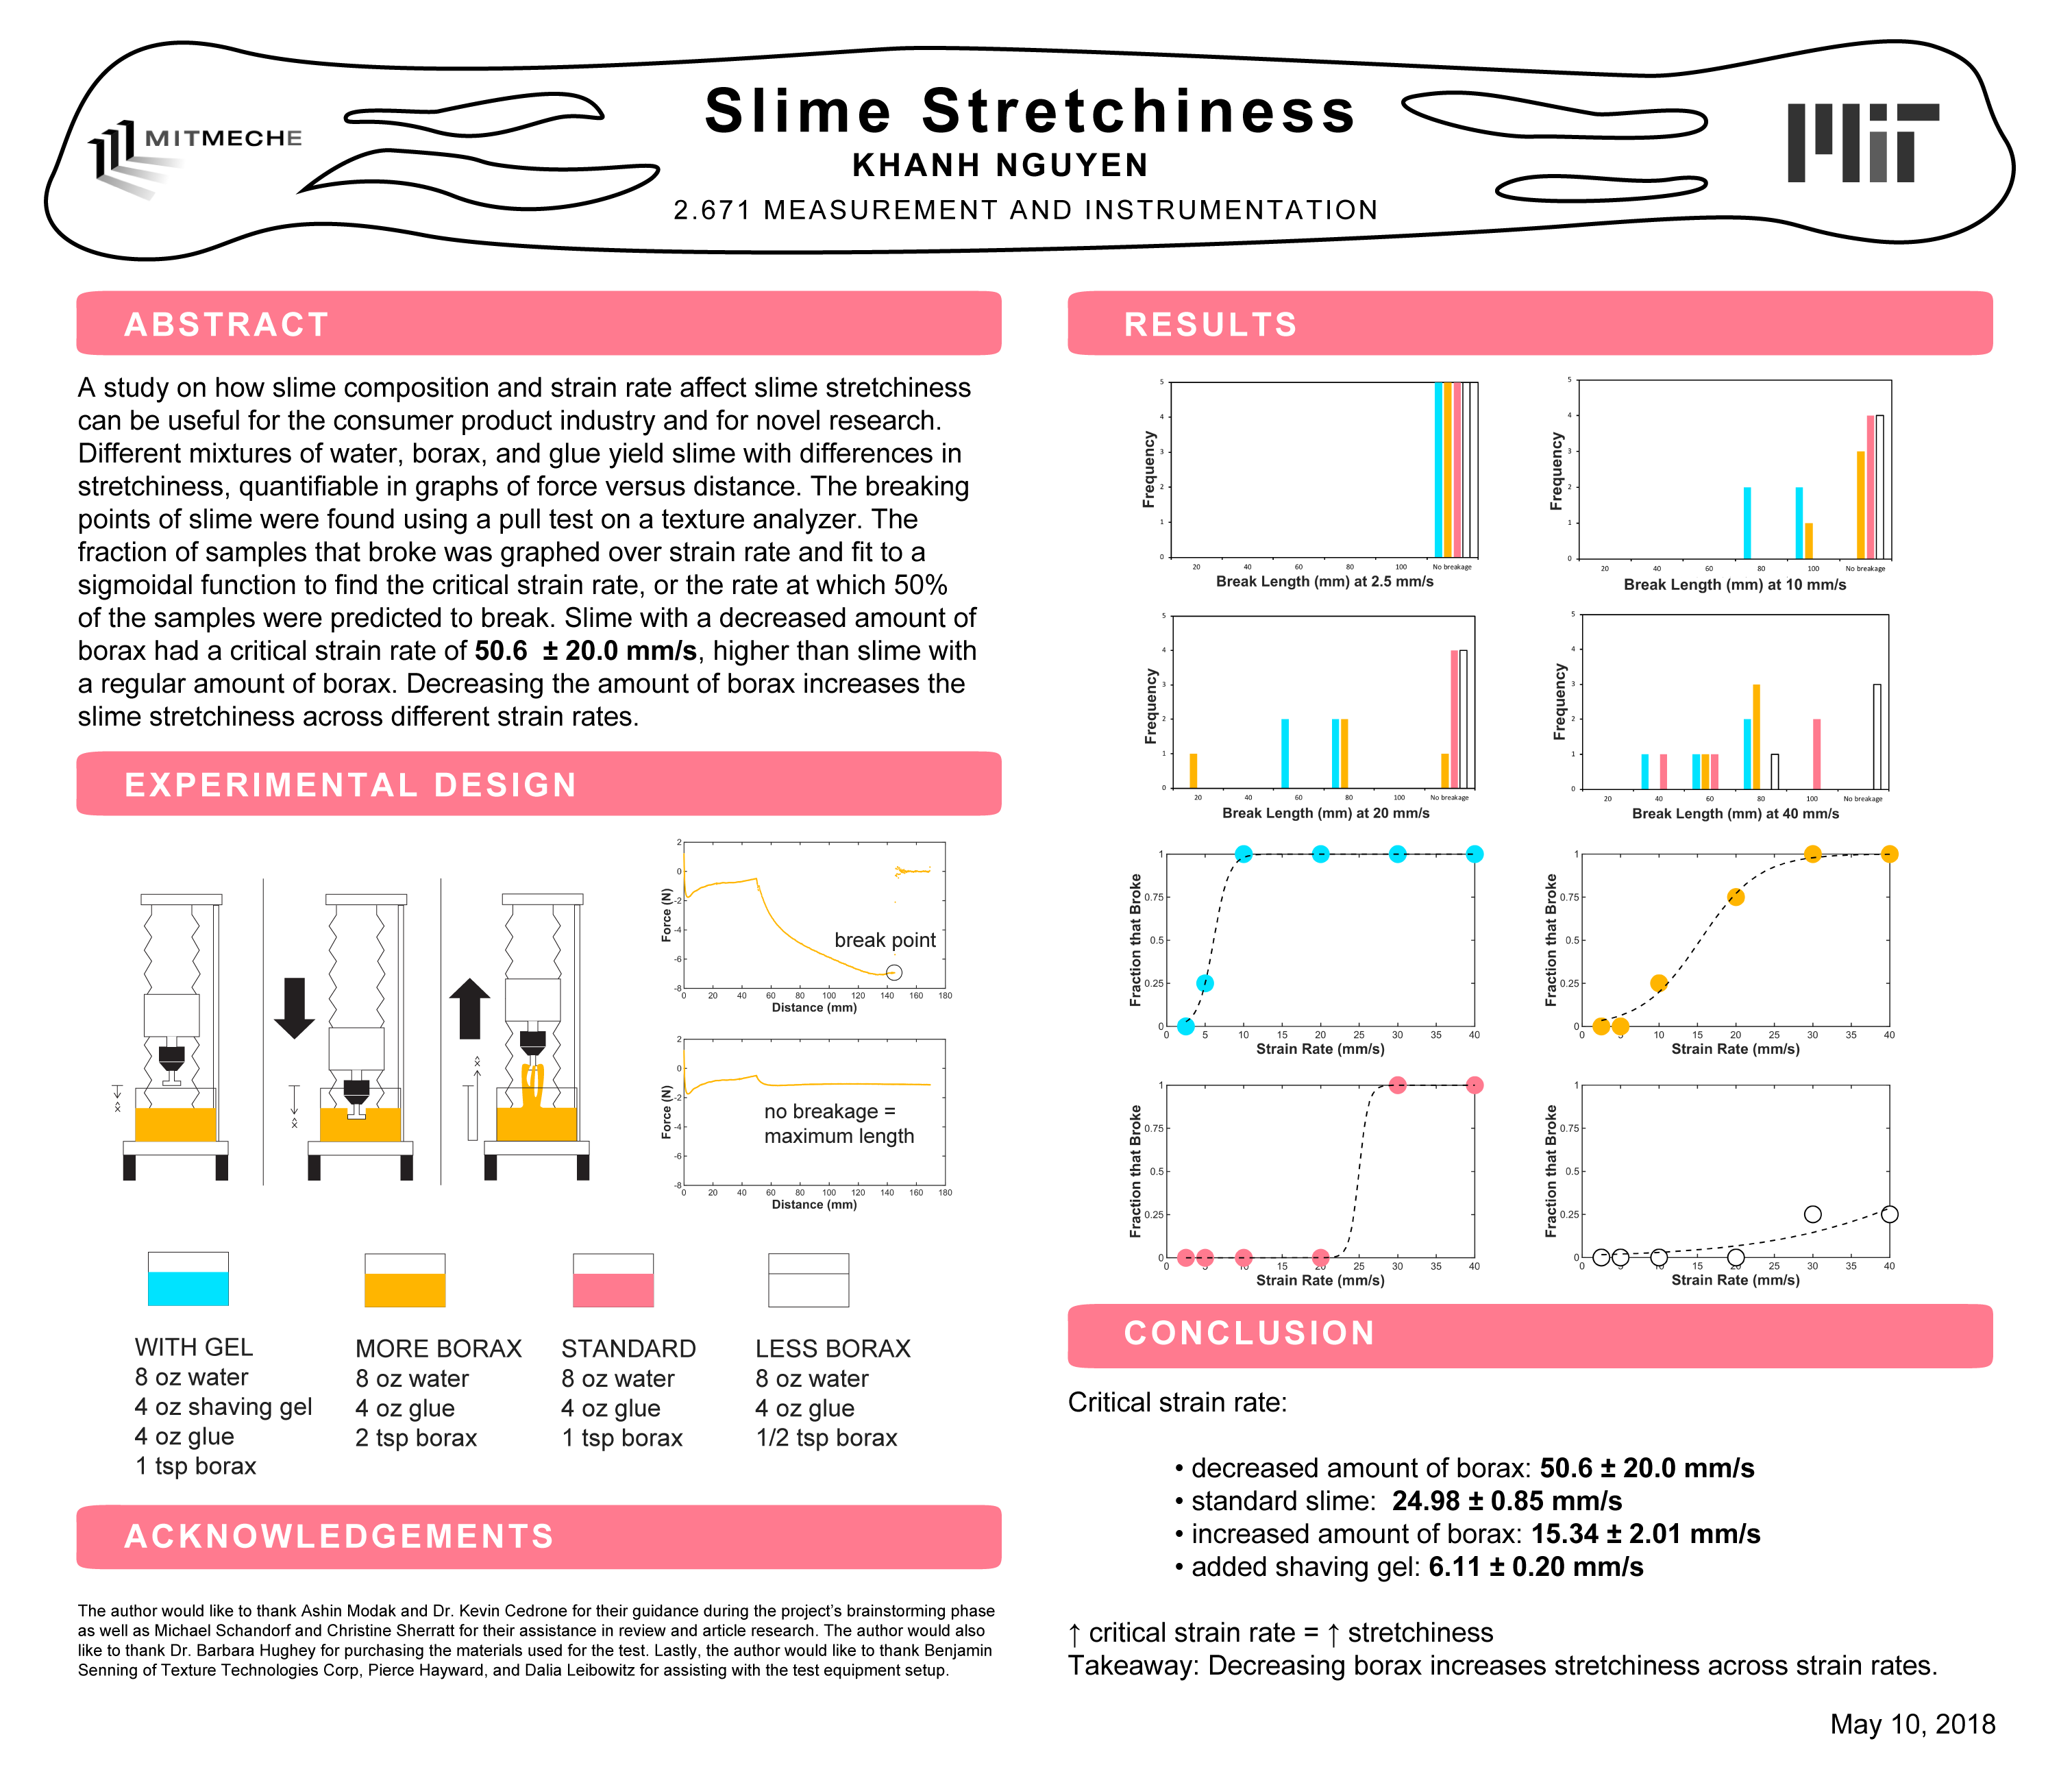
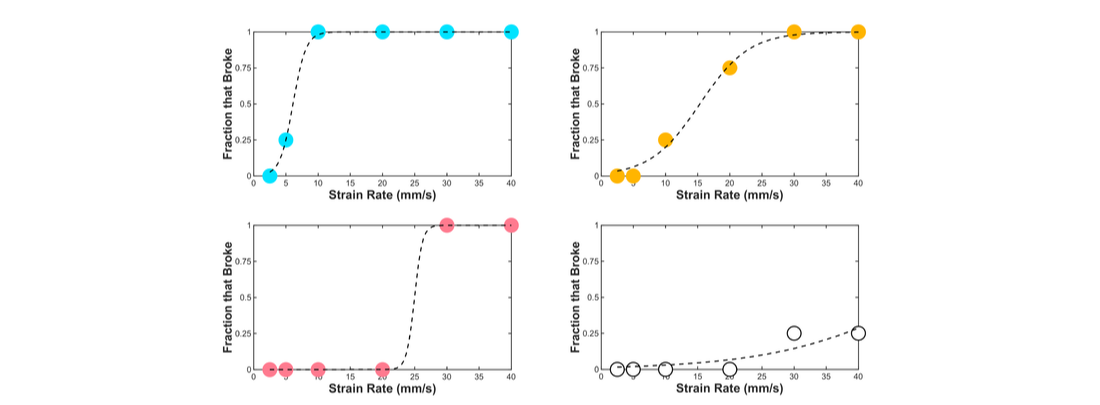
After consulting with my advisor, I decided to abandon a linear fit. I graphed the fraction of slimes that broke over the strain rate and fit the data to a sigmoidal function, or s-curve. This allowed me to find the critical strain rate, or the rate at which 50% of the slimes are predicted to break. I found that decreasing the amount of borax from the standard recommended slime recipe increased stretchiness. Further research can find the optimal amount of borax, as decreasing it entirely will result in no cross-linking of the polymer chains and thus no slime formation.
From this project, I was able to apply research to improve an existing consumer product, as well as crystallize a structured thought process for solving a specific problem based on many different possibilities. I learned how to pick an ideal quality of a product and to frame a research question around it, and then how to use existing engineering tools to collect and analyze data that will answer the question. I was able to use my analytical skills to structure a rigorous analysis from data that, at first glance, did not make the most sense.
I synthesized my results into a poster that was presented at an engineering symposium. I also wrote a research paper that can be found here. Thumbnails of the first and last pages of the research paper and of the full poster are shown below. Other applications from consumer products can be in the food industry or in the research of viscoelastic properties of slime to create stretchable strain sensors and electrochromic devices.


